-
Overview
Hennessy Energy Transition Fund
Actively managed, the Fund maintains a concentrated portfolio of companies across the full spectrum of the Energy sector.
Why Invest
- Opportunistically invests across the entire energy "value chain" seeking the best balance of reward and risk
- Concentrated, actively managed portfolio of 25-40 companies
- In-depth, rigorous "boots-on-the-ground" research led by managers with decades of combined energy investing experience
Investment Approach
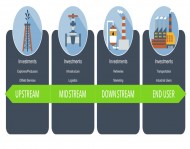
The Hennessy Energy Transition Fund invests across the full spectrum of the energy supply/demand value chain, including upstream, midstream, and downstream energy companies, as well as energy end-users. The Fund's Portfolio Managers have the flexibility to opportunistically move up and down this energy value chain, overweighting sectors they believe will generate the best balance of reward and risk.
The Portfolio Managers employ a fundamental, “boots-on-the-ground” research-intensive investment process to select holdings, focusing on four key steps:
- Develop commodity forecasts and key sector investment themes
- Identify primary beneficiaries of investment themes
- Value companies on both a relative and absolute basis to uncover potential stock mispricing opportunities
- Size position based on conviction, expected return, volatility, and liquidity
Portfolio Managers
“We carefully evaluate the best opportunities within the entire energy "value chain," including renewables and end-users.”
- Ben Cook
Share -
Insights & News
-
Performance
Daily Pricing & Performance
as of 4/25/24-
Investor Class (HNRGX)
-
NAV
$27.28
-
$ Change
$0.28
-
% Change
1.04%
-
YTD
14.96%
-
-
Institutional Class (HNRIX)
-
NAV
$27.85
-
$ Change
$0.28
-
% Change
1.02%
-
YTD
15.08%
-
Average Annualized Total Return
as of 3/31/24Name 1 Mo YTD 1 yr 3 yr 5 yr 10 yr Since Inception (12/31/13) Investor Class (HNRGX) 11.08% 11.93% 22.51% 26.97% 12.29% 3.73% 4.38% Institutional Class (HNRIX) 11.11% 12.02% 22.89% 27.41% 12.64% 4.02% 4.66% S&P 500® Energy Index 10.60% 13.68% 17.67% 30.00% 12.86% 4.74% 4.70% S&P 500® Index 3.22% 10.56% 29.88% 11.49% 15.05% 12.96% 12.83% as of 3/31/24Name QTR YTD 1 yr 3 yr 5 yr 10 yr Since Inception (12/31/13) Investor Class (HNRGX) 11.93% 11.93% 22.51% 26.97% 12.29% 3.73% 4.38% Institutional Class (HNRIX) 12.02% 12.02% 22.89% 27.41% 12.64% 4.02% 4.66% S&P 500® Energy Index 13.68% 13.68% 17.67% 30.00% 12.86% 4.74% 4.70% S&P 500® Index 10.56% 10.56% 29.88% 11.49% 15.05% 12.96% 12.83% Hypothetical Growth of $10,000
as of 3/31/2024Value of $10,000 invested between 3/31/2023 and 3/31/2024
Energy Transition Fund (HNRGX) $12,251 Energy Transition Fund (HNRIX) $12,289 S&P 500® Energy Index $11,766 S&P 500® Index $12,988 Value of $10,000 invested between 3/31/2021 and 3/31/2024
Energy Transition Fund (HNRGX) $20,467 Energy Transition Fund (HNRIX) $20,681 S&P 500® Energy Index $21,969 S&P 500® Index $13,859 Value of $10,000 invested between 3/31/2019 and 3/31/2024
Energy Transition Fund (HNRGX) $17,854 Energy Transition Fund (HNRIX) $18,132 S&P 500® Energy Index $18,309 S&P 500® Index $20,157 Value of $10,000 invested between 3/31/2014 and 3/31/2024
Energy Transition Fund (HNRGX) $14,420 Energy Transition Fund (HNRIX) $14,825 S&P 500® Energy Index $15,882 S&P 500® Index $33,826 Value of $10,000 invested between 12/31/2013 and 3/31/2024
Energy Transition Fund (HNRGX) $15,515 Energy Transition Fund (HNRIX) $15,951 S&P 500® Energy Index $16,008 S&P 500® Index $34,438 Calendar Year Total Returns
2014 2015 2016 2017 2018 2019 2020 2021 2022 2023 Investor Class (HNRGX) -1.75% -24.67% 42.96% 1.89% -31.16% 5.74% -25.72% 55.42% 47.53% 3.72% Institutional Class (HNRIX) -1.75% -24.41% 43.33% 2.17% -30.94% 6.05% -25.63% 56.02% 48.01% 4.09% S&P 500® Energy Index -7.78% -21.12% 27.36% -1.01% -18.09% 11.82% -33.68% 54.65% 65.71% -1.33% S&P 500® Index 13.69% 1.38% 11.96% 21.83% -4.38% 31.49% 18.40% 28.71% -18.11% 26.29% Returns-Based Statistics
Relative to S&P 500® Energy Indexas of 3/31/24Investor Class (HNRGX)Type 3 yr 5 yr 10 yr Alpha -1.47 0.58 0.00 Beta 0.97 1.08 1.10 Upside Capture 99.62 105.02 106.74 Downside Capture 108.53 107.29 109.97 Institutional Class (HNRIX)Type 3 yr 5 yr 10 yr Alpha -1.09 0.89 0.28 Beta 0.97 1.08 1.10 Upside Capture 99.98 105.27 107.00 Downside Capture 107.88 106.84 109.46 Alpha measures the fund’s excess return relative to the return of the benchmark. Beta measures the volatility of the fund compared to that of the benchmark. The beta of the benchmark is 1.00. Capture ratios measure the fund’s overall performance in up markets (positive return periods) and down markets (negative return periods).
Sharpe Ratio
as of 3/31/24Type 3 yr 5 yr 10 yr Investor Class (HNRGX) 0.87 0.45 0.24 Institutional Class (HNRIX) 0.88 0.45 0.25 S&P 500® Energy Index 0.95 0.45 0.25 Equity Energy Category Average 0.72 0.36 0.09 Sharpe Ratio is a measure of risk-adjusted return, reflecting the average return earned in excess of the risk-free rate per unit of volatility.
Standard Deviation
as of 3/31/24Type 3 yr 5 yr 10 yr Investor Class (HNRGX) 28.94 42.40 34.48 Institutional Class (HNRIX) 28.91 42.38 34.46 S&P 500® Energy Index 28.79 37.38 29.77 Equity Energy Category Average 27.90 38.47 31.82 Standard deviation is a statistical measure of the historical volatility of a mutual fund or portfolio.
Fund Expenses
-
Investor Class (HNRGX)
-
Gross expense ratio
2.42%
-
Net expense ratio
2.27%
-
-
Institutional Class (HNRIX)
-
Gross expense ratio
2.08%
-
Net expense ratio
1.93%
-
Performance data quoted represents past performance; past performance does not guarantee future results. The investment return and principal value of an investment will fluctuate so that an investor's shares, when redeemed, may be worth more or less than their original cost. Current performance of the fund may be lower or higher than the performance quoted.
Each Morningstar category average represents a universe of funds with similar objectives. The Morningstar Style Box reveals the fund's investment style as of 3/31/24. The vertical axis shows the market capitalization of the stocks owned and the horizontal axis shows investment style (value, blend, or growth). ©Morningstar, Inc. All Rights Reserved. Past performance is no guarantee of future results.
The S&P 500® Energy Index is an index that comprises those companies included in the S&P 500 that are classified as members of the GICS energy sector. The S&P 500® Index is an unmanaged index commonly used to measure the performance of U.S. stocks. One cannot invest directly in an index.
Standard & Poor’s Financial Services is the source and owner of the S&P® and S&P 500® trademarks.
The performance shown for periods on or prior to 10/26/18 is that of the predecessor BP Capital TwinLine Energy Fund.
Certain service provider expenses for the Energy Transition Fund will be voluntarily waived through 7/31/25.
Active share was calculated versus the Energy Select Sector SPDR Fund (XLE), which differs from the Fund's primary benchmark. References to other investment products should not be interpreted as an offer of these securities
Fund holdings and sector allocations are subject to change and should not be considered a recommendation to buy or sell any security.
-
-
Portfolio
Portfolio Allocation
as of 3/31/24Allocation % of Net Assets Upstream 76.7% Midstream 5.1% Downstream 7.3% End User 10.1% Renewable 0.0% Cash/Other 0.7% Portfolio Characteristics
as of 3/31/24Inception Date (HNRGX) 12/31/13 Inception Date (HNRIX) 12/31/13 Total Fund Assets $15 Million Active Share vs. Energy Select Sector SPDR Fund (XLE) 64% Portfolio Turnover 13% Median Market Cap $25.0 Billion Median Price/Earnings 14.9x Median Price/Book 3.1x Price/Earnings measures a stock’s price per share compared to earnings. Price/Book measures a stock’s price per share to book value. Portfolio Turnover and Price/Earnings shown reflect the trailing 12-month period.
Sector Weighting
as of 3/31/24Fund Energy 89.2% Materials 5.3% Utilities 4.8% Cash & Other 0.7% Sub-Industry Weighting % of Net Assets Oil & Gas Exploration & Production 45.8% Oil & Gas Equipment & Services 19.8% Integrated Oil & Gas 11.2% Oil & Gas Refining & Marketing 7.3% Copper 5.3% Oil & Gas Storage & Transportation 5.1% Electric Utilities 4.8% Portfolio Holdings
Top 10 Holdings
as of 3/31/24% of Net Assets Top 10 Holdings Ticker Current Vs. 4Q23 Vs. 1Q23 10-Year Holdings History (%) Time Held ConocoPhillips COP 6.00% +0.52% +1.81% 3 Years Antero Resources Corp. AR 5.99% -0.10% +1.98% 2 Years Canadian Natural Resources Ltd. CNQ 5.86% +0.09% +0.81% 1 Year EOG Resources, Inc. EOG 5.44% +0.29% +0.72% 4 Years Freeport-McMoRan, Inc. FCX 5.33% +0.22% +0.44% 3 Years Diamondback Energy, Inc. FANG 5.32% -0.16% +1.08% 10 Years Pioneer Natural Resources Co. PXD 5.30% -0.12% +0.64% 8 Years Chevron Corp. CVX 5.30% +0.29% +2.33% 2 Years Cheniere Energy, Inc. LNG 5.15% -0.86% -0.26% 4 Years Suncor Energy, Inc. SU 5.11% -0.90% -0.42% 3 Years Total as % of Net Assets 54.8% Total Holdings: 23
as of 3/31/24% of Net Assets Equity Holdings Current Vs. 4Q23 Vs. 1Q23 10-Year Holdings History (%) Time Held ConocoPhillips 6.00% +0.52% +1.81% 3 Years Antero Resources Corp. 5.99% -0.10% +1.98% 2 Years Canadian Natural Resources Ltd. 5.86% +0.09% +0.81% 1 Year EOG Resources, Inc. 5.44% +0.29% +0.72% 4 Years Freeport-McMoRan, Inc. 5.33% +0.22% +0.44% 3 Years Diamondback Energy, Inc. 5.32% -0.16% +1.08% 10 Years Pioneer Natural Resources Co. 5.30% -0.12% +0.64% 8 Years Chevron Corp. 5.30% +0.29% +2.33% 2 Years Cheniere Energy, Inc. 5.15% -0.86% -0.26% 4 Years Suncor Energy, Inc. 5.11% -0.90% -0.42% 3 Years Solaris Oilfield Infrastructure, Inc. 4.96% +0.40% +1.11% 3 Years NextEra Energy, Inc. 4.81% -0.17% +2.93% 4 Years Marathon Oil Corp. 4.76% +0.70% +2.39% 2 Years Halliburton Co. 4.27% +0.35% -0.13% 3 Years EQT Corp. 4.25% -0.19% +0.55% 3 Years Phillips 66 3.72% +0.25% +0.60% 2 Years Valero Energy Corp. 3.61% +0.86% +0.93% 1 Year TechnipFMC, PLC 2.92% +0.58% -1.64% 3 Years Comstock Resources, Inc. 2.84% +0.13% +0.63% 1 Year Schlumberger NV 2.61% -2.41% -2.50% 4 Years Tenaris SA 2.56% +0.29% -1.08% 2 Years NOV, Inc. 2.48% -0.10% +2.48% < 1 Year Exxon Mobil Corp. 0.76% -0.54% -4.30% 3 Years Total as % of Net Assets 99.4% Cash & Other Holdings % of Net Assets Cash & Other 0.7% Total as % of Net Assets 0.7% Country Allocation
as of 3/31/24-
United States
80.3%
-
International
19.1%
-
Cash & Other
0.7%
United States 80.3% Canada 11.0% United Kingdom 2.9% Luxembourg 2.6% Curacao 2.6% Cash & Other 0.7% -
-
Distributions
The Hennessy Energy Transition Fund pays capital gains (if any) once annually, usually in December. Ordinary income distributions (if any) are paid annually, usually in December.
Date Paid Income Short-Term Gain Long-Term Gain Total Per Share Reinvest Price 12/28/2022 $0.11746 -- -- $0.11746 $22.50 12/29/2021 $2.06575 -- -- $2.06575 $15.71 12/16/2014 -- $0.48157 -- $0.48157 $17.72 Past performance is not a guarantee of future results.
Download historical distributions and NAVsDate Paid Income Short-Term Gain Long-Term Gain Total Per Share Reinvest Price 12/28/2022 $0.17710 -- -- $0.17710 $22.87 12/29/2021 $2.11238 -- -- $2.11238 $15.95 12/27/2019 $0.03341 -- -- $0.03341 $15.40 11/29/2016 $0.03302 -- -- $0.03302 $19.10 12/16/2014 -- $0.48157 -- $0.48157 $17.72 Past performance is not a guarantee of future results.
Download historical distributions and NAVs -
Fund Documents
Download PDF View Online Energy Transition Fund Documents Fact Sheet Portfolio Perspective View Summary Prospectus Full Prospectus Statement of Additional Information Energy Transition Fund Shareholder Reports and Quarterly Holdings Q1 Holdings Semi-Annual Report Q3 Holdings Annual Report Currently, paper copies of the annual and semi-annual reports are not sent by mail unless shareholders specifically request paper copies. You may elect to receive paper copies free of charge by calling U.S. Bank Global Fund Services at 1-800-261-6950 or, if you own shares through a financial intermediary, by contacting your financial intermediary.
**Please note the upcoming change to shareholder report delivery.**
After July 24, 2024, shareholder reports will be sent by mail unless a shareholder has elected or elects to receive reports electronically via e-delivery. To sign up for e-delivery, please visit My Account. https://www.hennessyfunds.com/account or by calling U.S. Bank Global Fund Services at 1-800-261-6950 or, if you own shares through a financial intermediary, by contacting your financial intermediary.