The Investment Case for Natural Gas Utilities
The Portfolio Managers of the Hennessy Gas Utility Fund discuss the Fund’s composition, earnings growth, dividends, and the case for natural gas utilities and other distribution companies. They also cover how the price of natural gas affects the Fund’s holdings and highlight the portfolio’s exposure to renewables.
-
 Ryan C. Kelley, CFAChief Investment Officer and Portfolio Manager
 -
 L. Joshua Wein, CAIAPortfolio Manager
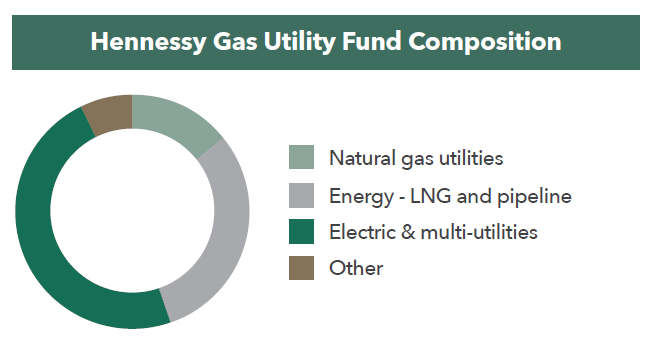
Would you please discuss the composition of the Fund?
The Fund’s composition has evolved over its 33-year history. At inception, the Fund was comprised almost entirely of natural gas utilities. Currently, the portfolio is divided into three primary categories: 48% of the Fund is in diversified electric and multi-utilities, 14% in pure play natural gas utilities, and 31% in the broader Energy Sector, which includes midstream pipeline companies, an LNG export company, and a natural gas exploration and production company. Another 7% is comprised primarily of a water utility and Berkshire Hathaway, which owns Berkshire Hathaway Energy.
Other notable points about the composition of the Fund include:
• Of the 51 holdings in the portfolio, the majority are based in the U.S. with 11% domiciled in Canada and 3% in the U.K.
• New holdings in 2022 include EQT Corporation, TC Energy, Alliant Energy, and DT Midstream.
• The Fund historically has experienced robust merger and acquisition activity. From 2015 through October 2022, of the 62 companies that were held in the Fund, 17 have since been acquired, which is more than a quarter of the holdings.
• With regard to rising rates, historically over 32 years of full calendar year performance, we see little to no correlation between the Fund’s annual total return and the change in interest rates.
Would you please discuss Utilities’ earnings growth along with the current level of dividends for the Fund’s holdings?
Historically, Utilities’ earnings growth has been around 3-4%, typically mirroring the U.S. economic growth rate. Although earnings have recently been flat due to the pandemic and diminished economic activity, estimates for 2022 and 2023 look more optimistic with earnings advancing at around 6% each year. Importantly, return on capital for Utilities has been steady and consistent at about 9-10%.
As of October 24, 2022, 48 of the 51 Fund holdings paid a dividend, with an average yield of 3.94% on average.1 In the past year, 44 of the 48 dividend paying companies raised their dividends approximately 3%. Over the past three years, average dividends grew at a 4.5% annualized rate.
What is the case for the use of natural gas?
We believe the natural gas industry remains a compelling investment opportunity for the following reasons:
-
Natural gas is an extremely efficient energy source. In contrast, electricity produced with natural gas at a power plant and then delivered through the electrical grid is only 36% efficient. Therefore, almost three times more energy would need to be produced at an electric power plant to replace any direct use of natural gas.
-
U.S. natural gas is abundant, affordable, and accessible. Approximately 95% of the energy used in the U.S. is produced in the country. In light of the current geopolitical situation in Europe, U.S. energy independence becomes particularly significant. Gas production is in the U.S.’s political control, which is important for national safety and security
-
The use of natural gas continues to grow. In 2007, natural gas and coal each comprised approximately 23% of the total energy consumed in the U.S. Currently, natural gas is 33% of total energy consumption while coal is only 10%. Renewables today comprise 14% of total energy consumed.
How has the fluctuating price of natural gas affected the companies in the Fund?
The price of natural gas is not a primary driver of the Hennessy Gas Utility Fund. Regardless of whether the price is higher or lower than average, current pricing is passed on to customers.
Many portfolio companies do not derive significant earnings from the commodity’s fluctuating price. Instead, they make their money on volume: the more gas flowing through the system fueling growing consumption, the higher their revenues. Similarly, they earn additional revenue based on growing capital expenditures, including infrastructure investments such as existing pipeline replacement and expanding their current footprint.
One major driver of these companies’ revenues and earnings is weather. Colder winters and hotter summers benefit the Fund’s holdings as more natural gas is used to cool or heat homes and businesses.
What is the Fund’s exposure to renewable energy?
Nearly every holding in the Fund has exposure to renewable energy either through a joint venture, a subsidiary, or ownership of an asset related to wind or solar. One example is Algonquin Power & Utilities Corp., with over 50% of its generation capacity from renewables, including wind, solar and hydroelectric power. Over the past five years, Algonquin has reduced its carbon emissions by 38% and has a net zero emissions target by 2050.
Renewables are a meaningful part of the Fund’s holdings as these companies have a vested interest in clean energy. We believe that there is a long runway for renewable energy sources as the world moves away from oil and coal and that natural gas and renewables will likely both be a large part of the energy complex in the decades to come.
- In this article:
- Energy
- Gas Utility Fund
You might also like
-
 Investment Idea
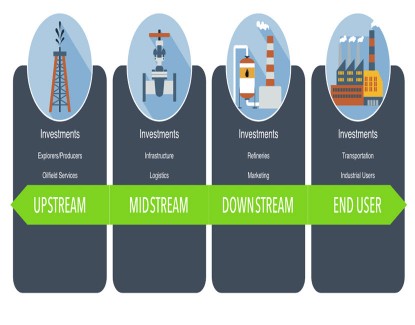
Defining the Energy "Value Chain"
 Ben Cook, CFAPortfolio ManagerRead the Investment Idea
Energy is a large and complex sector. The sector’s broad sub-industries can be divided into a “value chain,” each segment of which has different characteristics and offers different investment opportunities.
-
 Portfolio Perspective
Energy Transition FundEnergy - Attractively Valued Sector with Higher Free Cash Flow Yields
L. Joshua Wein, CAIAPortfolio Manager
Ben Cook, CFAPortfolio ManagerRead the CommentaryIn the following commentary, Portfolio Manager Ben Cook and Josh Wein discuss the Fund’s disciplined process throughout the volatility driven by tariff uncertainty and geopolitical developments.
-
 Portfolio Perspective
Gas Utility FundNatural Gas: Essential to Reliable Power
Ryan C. Kelley, CFAChief Investment Officer and Portfolio Manager
L. Joshua Wein, CAIAPortfolio ManagerRead the CommentaryUtilities have delivered strong returns in 2025, fueled by demand trends, earnings growth and their defensive nature, positioning natural gas utilities as a compelling opportunity amid market uncertainty.