-
Overview
Hennessy Energy Transition Fund
Actively managed, the Fund maintains a concentrated portfolio of companies across the full spectrum of the Energy sector.
Investor
HNRGXInstitutional
HNRIXMorningstar style box

Overall morningstar rating
Investor
HNRGX
-
Institutional
-
HNRIX
Among 63 Equity Energy Funds (Based on risk-adjusted returns, as of 6/30/26)

Why Invest
- Opportunistically invests across the entire energy "value chain" seeking the best balance of reward and risk
- Concentrated, actively managed portfolio of 25-40 companies
- In-depth, rigorous "boots-on-the-ground" research led by managers with decades of combined energy investing experience
Investment Approach
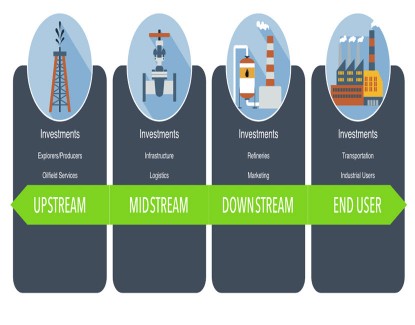
The Hennessy Energy Transition Fund invests across the full spectrum of the energy supply/demand value chain, including upstream, midstream, and downstream energy companies, as well as energy end-users. The Fund's Portfolio Managers have the flexibility to opportunistically move up and down this energy value chain, overweighting sectors they believe will generate the best balance of reward and risk.
The Portfolio Managers employ a fundamental, “boots-on-the-ground” research-intensive investment process to select holdings, focusing on four key steps:
- Develop commodity forecasts and key sector investment themes
- Identify primary beneficiaries of investment themes
- Value companies on both a relative and absolute basis to uncover potential stock mispricing opportunities
- Size position based on conviction, expected return, volatility, and liquidity
Portfolio Managers
“We carefully evaluate the best opportunities within the entire energy "value chain," including renewables and end-users.”
- Ben Cook
Share -
Insights & News
-
Performance
Daily Pricing & Performance
as of 7/27/26-
Investor Class (HNRGX)
-
NAV
$37.16
-
$ Change
-$0.89
-
% Change
-2.34%
-
YTD
23.41%
-
-
Institutional Class (HNRIX)
-
NAV
$38.08
-
$ Change
-$0.92
-
% Change
-2.36%
-
YTD
23.60%
-
Average Annualized Total Return
as of 6/30/26Name 1 Mo YTD 1 yr 3 yr 5 yr 10 yr Since Inception (12/31/13) Investor Class (HNRGX) -5.16% 17.14% 28.09% 17.04% 19.22% 8.80% 6.01% Institutional Class (HNRIX) -5.12% 17.30% 28.46% 17.42% 19.60% 9.12% 6.30% S&P 500® Energy Index -5.06% 19.65% 29.04% 12.81% 19.01% 8.65% 5.43% S&P 500® Index -0.95% 10.21% 22.33% 20.61% 13.41% 15.51% 13.85% as of 6/30/26Name QTR YTD 1 yr 3 yr 5 yr 10 yr Since Inception (12/31/13) Investor Class (HNRGX) -10.25% 17.14% 28.09% 17.04% 19.22% 8.80% 6.01% Institutional Class (HNRIX) -10.19% 17.30% 28.46% 17.42% 19.60% 9.12% 6.30% S&P 500® Energy Index -13.45% 19.65% 29.04% 12.81% 19.01% 8.65% 5.43% S&P 500® Index 15.20% 10.21% 22.33% 20.61% 13.41% 15.51% 13.85% Hypothetical Growth of $10,000
as of 6/30/2026Value of $10,000 invested between 6/30/2025 and 6/30/2026
Energy Transition Fund (HNRGX) $12,809 Energy Transition Fund (HNRIX) $12,846 S&P 500® Energy Index $12,898 S&P 500® Index $12,233 Value of $10,000 invested between 6/30/2023 and 6/30/2026
Energy Transition Fund (HNRGX) $16,034 Energy Transition Fund (HNRIX) $16,188 S&P 500® Energy Index $14,346 S&P 500® Index $17,547 Value of $10,000 invested between 6/30/2021 and 6/30/2026
Energy Transition Fund (HNRGX) $24,080 Energy Transition Fund (HNRIX) $24,469 S&P 500® Energy Index $23,853 S&P 500® Index $18,757 Value of $10,000 invested between 6/30/2016 and 6/30/2026
Energy Transition Fund (HNRGX) $23,235 Energy Transition Fund (HNRIX) $23,931 S&P 500® Energy Index $22,909 S&P 500® Index $42,271 Value of $10,000 invested between 12/31/2013 and 6/30/2026
Energy Transition Fund (HNRGX) $20,728 Energy Transition Fund (HNRIX) $21,460 S&P 500® Energy Index $19,344 S&P 500® Index $50,592 Calendar Year Total Returns
2016 2017 2018 2019 2020 2021 2022 2023 2024 2025 Investor Class (HNRGX) 42.96% 1.89% -31.16% 5.74% -25.72% 55.42% 47.53% 3.72% 13.49% 12.48% Institutional Class (HNRIX) 43.33% 2.17% -30.94% 6.05% -25.63% 56.02% 48.01% 4.09% 13.84% 12.86% S&P 500® Energy Index 27.36% -1.01% -18.09% 11.82% -33.68% 54.65% 65.71% -1.33% 5.72% 8.67% S&P 500® Index 11.96% 21.83% -4.38% 31.49% 18.40% 28.71% -18.11% 26.29% 25.02% 17.88% Year Investor Class (HNRGX) Institutional Class (HNRIX) S&P 500® Energy Index S&P 500® Index 2015 -24.67% -24.41% -21.12% 1.38% 2014 -1.75% -1.75% -7.78% 13.69% Returns-Based Statistics
Relative to S&P 500® Energy Indexas of 6/30/26Investor Class (HNRGX)Type 3 yr 5 yr 10 yr Alpha 4.74 1.23 0.86 Beta 0.87 0.93 1.07 Upside Capture 94.65 96.47 102.63 Downside Capture 71.64 93.55 102.72 Institutional Class (HNRIX)Type 3 yr 5 yr 10 yr Alpha 5.06 1.56 1.16 Beta 0.87 0.93 1.07 Upside Capture 95.33 96.88 102.98 Downside Capture 71.01 92.93 102.22 Alpha measures the fund’s excess return relative to the return of the benchmark. Beta measures the volatility of the fund compared to that of the benchmark. The beta of the benchmark is 1.00. Capture ratios measure the fund’s overall performance in up markets (positive return periods) and down markets (negative return periods).
Sharpe Ratio
as of 6/30/26Type 3 yr 5 yr 10 yr Investor Class (HNRGX) 0.70 0.67 0.35 Institutional Class (HNRIX) 0.72 0.69 0.36 S&P 500® Energy Index 0.48 0.65 0.35 Equity Energy Category Average 0.54 0.54 0.26 Sharpe Ratio is a measure of risk-adjusted return, reflecting the average return earned in excess of the risk-free rate per unit of volatility.
Standard Deviation
as of 6/30/26Type 3 yr 5 yr 10 yr Investor Class (HNRGX) 18.09 25.35 33.41 Institutional Class (HNRIX) 18.11 25.33 33.39 S&P 500® Energy Index 19.25 25.98 29.73 Equity Energy Category Average 17.25 24.24 30.70 Standard deviation is a statistical measure of the historical volatility of a mutual fund or portfolio.
Fund Expenses
-
Investor Class (HNRGX)
-
Gross expense ratio
2.70%
-
Net expense ratio
2.53%
-
-
Institutional Class (HNRIX)
-
Gross expense ratio
2.37%
-
Net expense ratio
2.20%
-
Performance data quoted represents past performance; past performance does not guarantee future results. The investment return and principal value of an investment will fluctuate so that an investor's shares, when redeemed, may be worth more or less than their original cost. Current performance of the fund may be lower or higher than the performance quoted.
Morningstar Proprietary Ratings reflect risk-adjusted performance as of 6/30/26. The Morningstar Rating™ for funds, or "star rating", is calculated for managed products (including mutual funds, variable annuity and variable life subaccounts, exchange-traded funds, closed-end funds, and separate accounts) with at least a three-year history. Exchange-traded funds and open-ended mutual funds are considered a single population for comparative purposes. It is calculated based on a Morningstar Risk-Adjusted Return measure that accounts for variation in a managed product's monthly excess performance, placing more emphasis on downward variations and rewarding consistent performance. The top 10% of products in each product category receive 5 stars, the next 22.5% receive 4 stars, the next 35% receive 3 stars, the next 22.5% receive 2 stars, and the bottom 10% receive 1 star. The Overall Morningstar Rating™ for a managed product is derived from a weighted average of the performance figures associated with its three-, five-, and 10-year (if applicable) Morningstar Rating™ metrics. The weights are: 100% three-year rating for 36-59 months of total returns, 60% five-year rating/40% three-year rating for 60-119 months of total returns, and 50% 10-year rating/30% five-year rating/20% three-year rating for 120 or more months of total returns. While the 10-year overall star rating formula seems to give the most weight to the 10-year period, the most recent three-year period actually has the greatest impact because it is included in all three rating periods. Institutional Class (HNRIX) received 4 stars for the three-year, 4 stars for the five-year and 3 stars for the ten-year periods ended 6/30/26 / Investor Class (HNRGX) received 4 stars for the three-year, 4 stars for the five-year and 3 stars for the ten-year periods ended 6/30/26 among 63, 58 and 53 Equity Energy Funds, respectively. Each share class is counted as a fraction of one fund within this scale and rated separately, which may cause slight variations in distribution percentage.
Each Morningstar category average represents a universe of funds with similar objectives. The Morningstar Style Box reveals the fund's investment style as of 6/30/26. The vertical axis shows the market capitalization of the stocks owned and the horizontal axis shows investment style (value, blend, or growth). ©Morningstar, Inc. All Rights Reserved. Past performance is no guarantee of future results.The S&P 500® Energy Index is an index that comprises those companies included in the S&P 500 that are classified as members of the GICS energy sector. The S&P 500® Index is an unmanaged index commonly used to measure the performance of U.S. stocks. One cannot invest directly in an index.
Standard & Poor’s Financial Services is the source and owner of the S&P® and S&P 500® trademarks.
The performance shown for periods on or prior to 10/26/18 is that of the predecessor BP Capital TwinLine Energy Fund.
Certain service provider expenses for the Energy Transition Fund will be voluntarily waived through 7/31/28.
Active share was calculated versus the Energy Select Sector SPDR Fund (XLE), which differs from the Fund's primary benchmark. References to other investment products should not be interpreted as an offer of these securities
Fund holdings and sector allocations are subject to change and should not be considered a recommendation to buy or sell any security.
-
-
Portfolio
Portfolio Allocation
as of 6/30/26Allocation % of Net Assets Upstream 68.3% Midstream 10.3% Downstream 8.0% End User 10.0% Renewable 0.0% Cash/Other 3.3% Portfolio Characteristics
as of 6/30/26Inception Date (HNRGX) 12/31/13 Inception Date (HNRIX) 12/31/13 Total Fund Assets $15 Million Active Share vs. Energy Select Sector SPDR Fund (XLE) 58% Portfolio Turnover 70% Median Market Cap $57.9 Billion Median Price/Earnings 18.0x Median Price/Book 2.1x Price/Earnings measures a stock’s price per share compared to earnings. Price/Book measures a stock’s price per share to book value. Portfolio Turnover and Price/Earnings shown reflect the trailing 12-month period.
Sector Weighting
as of 6/30/26Fund Energy 82.0% Utilities 9.5% Materials 5.3% Cash & Other 3.3% Sub-Industry Weighting % of Net Assets Oil & Gas Exploration & Production 34.4% Oil & Gas Equipment & Services 19.7% Oil & Gas Storage & Transportation 10.3% Integrated Oil & Gas 9.6% Oil & Gas Refining & Marketing 8.0% Copper 5.3% Electric Utilities 4.8% Gas Utilities 4.7% Portfolio Holdings
Top 10 Holdings
as of 6/30/26% of Net Assets Top 10 Holdings Ticker Current Vs. 1Q26 Vs. 2Q25 10-Year Holdings History (%) Time Held ExxonMobil Holdings Corp. XOM 5.37% -0.39% -0.44% 5 Years Freeport-McMoRan, Inc. FCX 5.25% +1.01% +0.15% 6 Years Cheniere Energy, Inc. LNG 5.18% +1.99% +0.14% 6 Years EQT Corp. EQT 4.92% +1.65% +0.55% 5 Years Diamondback Energy, Inc. FANG 4.85% +0.13% +1.13% 12 Years Phillips 66 PSX 4.81% +1.10% +0.89% 4 Years NextEra Energy, Inc. NEE 4.77% +0.41% -0.05% 6 Years NOV, Inc. NOV 4.74% +0.58% +0.58% 3 Years EOG Resources, Inc. EOG 4.73% +0.17% +0.39% 7 Years National Fuel Gas Co. NFG 4.69% +1.54% -0.76% 2 Years Total as % of Net Assets 49.31% Total Equity Holdings: 26
as of 6/30/26% of Net Assets Equity Holdings Current Vs. 1Q26 Vs. 2Q25 10-Year Holdings History (%) Time Held ExxonMobil Holdings Corp. 5.37% -0.39% -0.44% 5 Years Freeport-McMoRan, Inc. 5.25% +1.01% +0.15% 6 Years Cheniere Energy, Inc. 5.18% +1.99% +0.14% 6 Years EQT Corp. 4.92% +1.65% +0.55% 5 Years Diamondback Energy, Inc. 4.85% +0.13% +1.13% 12 Years Phillips 66 4.81% +1.10% +0.89% 4 Years NextEra Energy, Inc. 4.77% +0.41% -0.05% 6 Years NOV, Inc. 4.74% +0.58% +0.58% 3 Years EOG Resources, Inc. 4.73% +0.17% +0.39% 7 Years National Fuel Gas Co. 4.69% +1.54% -0.76% 2 Years Antero Resources Corp. 4.60% +1.02% -0.21% 5 Years Halliburton Co. 4.53% +0.03% +0.65% 5 Years Expand Energy Corp. 4.52% +0.75% +0.76% 1 Year Tenaris SA 4.41% +0.41% +1.46% 4 Years SLB, Ltd. 4.38% +0.19% +0.43% 6 Years ConocoPhillips 4.35% -0.42% -3.80% 5 Years Chevron Corp. 4.20% -0.33% -0.65% 4 Years TXO Partners, LP 3.24% +3.24% +3.24% < 1 Year Williams Companies, Inc. 2.84% -0.71% +2.84% 1 Year Devon Energy Corp. 2.03% -0.11% +2.03% < 1 Year Valero Energy Corp. 1.85% -2.03% -3.40% 3 Years ProFrac Holding Corp. 1.67% +0.13% +0.65% 2 Years Marathon Petroleum Corp. 1.38% +0.24% +1.38% < 1 Year Energy Transfer LP 1.25% -1.62% +1.25% < 1 Year Chord Energy Corp. 1.12% +1.12% +1.12% < 1 Year Kinder Morgan, Inc. 1.07% +0.10% +1.07% < 1 Year Total as % of Net Assets 96.8% Cash & Other Holdings % of Net Assets Cash & Other 3.3% Total as % of Net Assets 3.3% Country Allocation
as of 6/30/26-
United States
87.9%
-
International
8.8%
-
Cash & Other
3.3%
United States 87.9% Curacao 4.4% Luxembourg 4.4% Cash & Other 3.3% -
-
Distributions
The Hennessy Energy Transition Fund pays capital gains (if any) once annually, usually in December. Ordinary income distributions (if any) are paid annually, usually in December.
Date Paid Income Short-Term Gain Long-Term Gain Total Per Share Reinvest Price 12/29/2025 $0.15766 -- -- $0.15766 $30.05 12/27/2024 $0.02081 -- -- $0.02081 $26.40 12/28/2022 $0.11746 -- -- $0.11746 $22.50 12/29/2021 $2.06575 -- -- $2.06575 $15.71 12/16/2014 -- $0.48157 -- $0.48157 $17.72 Past performance is not a guarantee of future results.
Download historical distributions and NAVsDate Paid Income Short-Term Gain Long-Term Gain Total Per Share Reinvest Price 12/29/2025 $0.23792 -- -- $0.23792 $30.74 12/27/2024 $0.03814 -- -- $0.03814 $27.00 12/28/2022 $0.17710 -- -- $0.17710 $22.87 12/29/2021 $2.11238 -- -- $2.11238 $15.95 12/27/2019 $0.03341 -- -- $0.03341 $15.40 11/29/2016 $0.03302 -- -- $0.03302 $19.10 12/16/2014 -- $0.48157 -- $0.48157 $17.72 Past performance is not a guarantee of future results.
Download historical distributions and NAVs -
Fund Documents
After July 24, 2024, shareholder reports will be sent by mail unless a shareholder has elected or elects to receive reports electronically via e-delivery. To sign up for e-delivery, please visit My Account. https://www.hennessyfunds.com/account or by calling U.S. Bank Global Fund Services at 1-800-261-6950 or, if you own shares through a financial intermediary, by contacting your financial intermediary.