Natural Gas Remains a Fuel of Choice
The Portfolio Managers of the Hennessy Gas Utility Fund discuss America’s role as a global supplier of natural gas, the Fund’s alternative energy exposure, earnings growth expectations, and how Utilities perform in a rising rate environment.
-
 Ryan C. Kelley, CFAChief Investment Officer and Portfolio Manager
 -
 L. Joshua Wein, CAIAPortfolio Manager
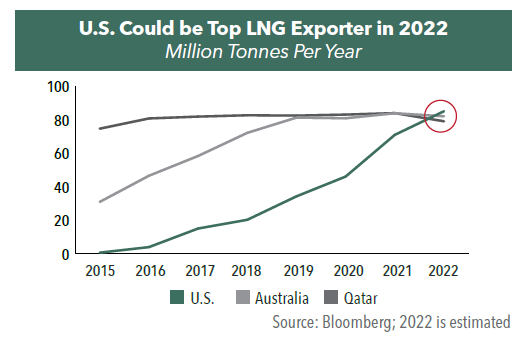
How have recent global tensions affected the America’s role as a global supplier of natural gas?
The recent, unfortunate events with Russia and Ukraine have underscored a strong demand for U.S. natural gas. In fact, it is expected that 2022 will be the first time the U.S. exported more liquefied natural gas (LNG) than any other country, surpassing Australia and Qatar. In the final week of January 2022, U.S. LNG exports averaged about 13 billion cubic feet (BCF) per day, about 25% greater than last year.
The conflict in Europe has made U.S. exports even more desirable as pressures mount over disruptions in Russian natural gas. As a case in point, last June about 60% of U.S. LNG was shipped to Asia. In January 2022, 70% went to Europe.
The economics are advantageous for the U.S., regardless of whether LNG is shipped to Europe, Asia, or any other part of the world. U.S. natural gas prices range between $4 and $5 per million British thermal units (BTU) compared to over $30 in Asia and Europe. This large price advantage is benefitting many companies involved in LNG exportation including Cheniere—a 5% holding in the Hennessy Gas Utility Fund.
What is the expectation for earnings growth for natural gas companies?
Earnings per share growth has been robust due to three main factors:
1. The growing importance of natural gas and its usage domestically.
2. An increasingly accommodative regulatory environment, which has allowed these companies to earn robust returns on invested capital.
3. A huge undertaking in pipeline replacement and modernization, which has driven capital expenditures and subsequently earnings growth.
In the past, the long-term growth rate of earnings per share (EPS) for utilities was in the 3% to 5% range. Now, EPS growth has nearly doubled to about 6% to 8%. Increases in natural gas pipeline replacement was one factor that drove capital spending and helped significantly increase long-term EPS growth rates for gas utilities.
How might electric utilities be impacted by the “electrification of everything”?
The world is entering a period where more electricity and significantly more grid capacity will be needed as more people buy electric vehicles and other appliances which use electricity. To meet this demand, companies are going to have to invest heavily. In 2021, $755 billion was invested globally in renewable energy and the electric grid, and according to some studies, the figure may have to double through 2030 and quadruple by the end of 2050. Regardless of the scale of the project, any investment in energy could be a boon to Utilities’ earnings growth.
What is the role of natural gas in a transition to cleaner fuel sources?
In 2020, 20% of electricity generated was from renewables, which is up from about 5% two decades ago. We will likely see that figure continue to rise. In fact, renewable energy is anticipated to be the fastest growing fuel across all categories.
However, we believe natural gas will continue to be an important part of the transition to cleaner fuel sources as it complements renewables by providing reliable energy during peak, emergency, and seasonal demand periods. In order for net zero emissions goals to be achieved, it will need to be accomplished concurrently across multiple energy sources.
How many Fund holdings have exposure to alternative energy revenue sources?
The Fund is primarily focused on the distribution side of natural gas, which include utilities, major pipeline companies, and LNG exportation businesses. Of these, about two-thirds of the Fund’s holdings have exposure to renewable energy, including hydro, solar, and wind. Looking ahead, many more companies plan to increase investments in renewables.
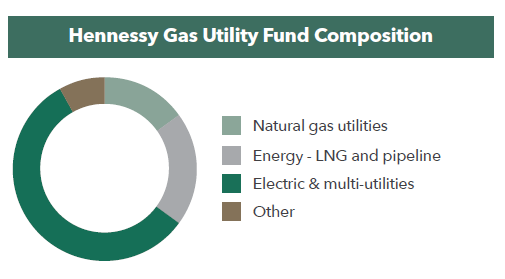
Would you please discuss the Fund’s portfolio composition?
The Fund’s composition has changed dramatically throughout its 32-year history. Currently, the portfolio is divided into three primary categories: diversified electric and multi-utilities (57%), pure play natural gas utilities (15%), and Energy sector companies including LNG and major pipeline companies (20%). The remaining 8% is comprised of cash, a water utility, and a financial company.
Importantly, because the Fund does not invest in exploration and production (E&P) companies, the price of the commodity is not a major driver of the Fund’s performance. Rather the price gets passed through to natural gas customers.
Instead, the Fund and earnings over time are generally driven by the demand and usage of natural gas and electricity. Simply stated, the more the meter spins, the greater the earnings for these companies.
Would you please comment on the dividend growth rate of companies in the Fund?
Over the last three years, the overall dividend growth rate for the companies in the Fund averaged 4.23% per year, in line with its historical rate. The one-year average dividend growth rate was a little lower at 3.79%, however, some companies were growing their annual dividends at 8-10% per year. Importantly, the increase in dividends resulted from a growth in earnings.
As of 2/20/22, 45 of the Fund’s 48 holdings paid a dividend, with an average yield of 3.55%.1
- In this article:
- Energy
- Gas Utility Fund
You might also like
-
 Portfolio Perspective
Midstream FundPotential Natural Gas Tailwinds for Midstream Companies
 Ben Cook, CFAPortfolio Manager
L. Joshua Wein, CAIAPortfolio ManagerRead the Commentary
Ben Cook, CFAPortfolio Manager
L. Joshua Wein, CAIAPortfolio ManagerRead the CommentaryThe following commentary highlights how recent events in Venezuela affect midstream investors, how midstream companies could benefit from interest rate cuts, rising natural gas and LNG demand, and AI-driven efficiencies, while maintaining disciplined capital allocation, strong shareholder returns, and attractive valuations.
-
 Portfolio Perspective
Energy Transition FundThe Role of Natural Gas to Meet AI Energy Demand
Ben Cook, CFAPortfolio Manager
L. Joshua Wein, CAIAPortfolio ManagerRead the CommentaryIn the following commentary, Portfolio Manager Ben Cook and Josh Wein highlight the Fund’s 2025 outperformance, discuss the impact the events in Venezuela may have on the energy sector, and outline key 2026 Energy sector opportunities.
-
 Portfolio Perspective
Gas Utility FundNatural Gas Utilities as a Potential Growth Story
Ryan C. Kelley, CFAChief Investment Officer and Portfolio Manager
L. Joshua Wein, CAIAPortfolio ManagerRead the CommentaryWith AI-driven power demand, rising capital investments, LNG growth, and pipeline infrastructure expansion, natural gas utilities are being repositioned as potential growth stories with attractive valuations and dividends.