Market Commentary and Fund Performance
Masa Takeda of Tokyo-based SPARX Asset Management Co., Ltd., sub-advisor to the Hennessy Japan Fund, shares his insights on the market and Fund performance.
-
 Masakazu Takeda, CFA, CMAPortfolio Manager
Fund Performance Review
For the month of September 2020, the Fund generated a positive return of 1.75% (HJPIX), while the Tokyo Stock Price Index rose 1.79%. The Russell/Nomura Total Market™ Index, the benchmark for the Fund, increased by 1.32% over the same period.
Laggards for the month include Shimano Inc., global top market share bicycle parts manufacturer, Daikin Industries, LTD, the leading global manufacturer of commercial-use air conditioners, and Takeda Pharmaceutical Company Limited, a multinational pharmaceutical company.
Among the best performers were our investments in Keyence, the supplier of factory automation related sensors, Nidec Corporation, the world’s leading comprehensive motor manufacturer, and Misumi Group, Inc., the maker and distributor of metal mold components and precision machinery parts.
One of the intriguing arguments behind Keyence is its potential for expanding its international business. Currently, its overseas revenue makes up roughly half of total revenue. It started to accelerate around fiscal year (FY) 2012, after the company had opened numerous branch offices around the world during the prior decade. From FY2011 to FY2019, the foreign sales ratio expanded from 31% to 53%, partially attributable to a weak yen brought on by the Bank of Japan’s quantitative monetary easing measures, but also driven by organic growth.
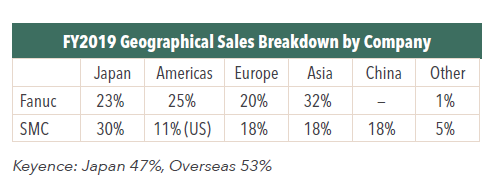
We often ask ourselves “how much more can we expect their overseas ratio to rise”? One approach is to turn to examples of other Japanese industrial companies with long histories of overseas expansion, namely Fanuc and SMC.

These compare to Keyence, which has 47% from Japan and 53% from overseas. Fanuc and SMC both have longer track records as global industrial players than Keyence, leading us to believe that they can be a proxy for Keyence’s future revenue mix. That is to say, Keyence should still have ample room for international sales up to a point where the domestic segment will represent a much smaller portion of total revenue (say, 20-30%). This is very encouraging.
For a more optimistic outlook, we can also look at the size of the Japanese GDP in relation to other major economies and “guesstimate” the addressable market size abroad accordingly. In that vein, Japan represents 6% of the world economy, while the US GDP contributes 24% with Europe and China around 20% and 15%, respectively. If Keyence’s geographical revenue breakdown mirrors this, then the company’s international sales could be 10 times bigger than domestic sales at some point in the future.
What’s more, the striking difference between Keyence and Fanuc and SMC is that while the latter pair has stagnated in absolute sales in their domestic segment, Keyence is still growing. For instance, compared to the pre-global financial crisis levels, today’s domestic revenues for Fanuc and SMC are 23% below their peak and flat, respectively. On the contrary, Keyence’s domestic business continues to expand, rising by more than 70% in revenue terms during the same period. This suggests that Keyence’s factory automation (FA) sensors business has a much longer growth runway globally than its peers.
Changing the subject, we would also like to share our stance on two negative views on Keyence that are often the subject matter in financial articles.
One is its stingy shareholder return policy. Thanks to its highly profitable FA sensor development capabilities that requires very little in the way of capital expenditure, the company generates ample free cash flow every year. For many years, shareholders have been demanding increases in the payout ratio, which on average has been less than 10% over the last decade (the company has been slowly raising dividends lately but investors believe the company could do far more given its profitability and extremely cash-rich balance sheet). In the past, we have indeed cast our votes against the company’s dividend proposal plan to express the same frustration.
Nevertheless, we have been a big fan of this company as we believe that shareholders have been rewarded handsomely through the appreciation of the share price. From FY2008 through FY2019, the company produced roughly $13 billion of net profits in aggregate, of which a whopping 90% were retained without any plans of redeploying it. While such a capital allocation practice should be condemned in light of the corporate governance reforms that have been unfolding in Japan, the company did create more than one dollar in market value for every dollar retained. In fact, the company’s market cap increased by $90 billion during this period driven by strong earnings growth and re-rating from depressed valuations. It is also worth noting that despite the bloated balance sheet (total assets of $17 billion versus shareholders’ equity of $16 billion and net cash of $15 billion), its return on equity comfortably outstrips the average Japanese company.
The second point is skepticism leveled against the company’s profitability. From time to time, we have seen foreign media arguing that the company’s margins are too high and almost too good to be true. Implicit in this criticism is a degree of doubt around the company’s accounting. I think this is misplaced.
Just a quick glance at its financial statements can tell the readers that the business is genuine. For instance, between FY2008 and FY2019, Keyence cumulatively generated operating cash flows of JPY 1,341 billion ($12.75 billion). Subtracting cumulative dividend payments of JPY 106 billion ($1.01 billion) from this (as from purchases of short-term financial assets and investment securities [mostly government bonds] for parking cash, the company has no other use for its operating cash flow), you get JPY 1,235 billion ($11.74 billion). This roughly matches increases in cash and cash equivalents (including investment securities) of JPY 1,191 billion ($11.32 billion) during the period.
The company’s accounting integrity is also evident from its pristine balance sheet. The asset side mainly consists of cash and cash equivalents and account receivables, with minimal inventory and tangible fixed assets. On the liabilities and equity side, 95% of it is made up of shareholders’ equity and the rest is in provisions for future expenses. From our experience, balance sheets of “shady” businesses typically keep bad assets under wraps using accounting items like “other current assets,” “other receivables,” or “short-term loan to affiliates.” This also causes the asset side of the balance sheet to appear very “congested” with all the obscure items. For such companies, you will also find very few provisions or allowances on the liabilities side potentially indicating underestimation of future expenses. Keyence is the polar opposite in our view. Its balance sheet is extremely “light” on the asset side with various provisions accounting for the bulk of its small liabilities.
- In this article:
- Japan
- Japan Fund
You might also like
-
 Portfolio Perspective
Japan Small Cap FundA Focus on Japanese Small-Caps Making Big Corporate Improvements
 Takenari Okumura, CMAPortfolio Manager
 Tadahiro Fujimura, CFA, CMAPortfolio ManagerRead the Commentary
The Portfolio Managers discuss their view of the Japanese small-cap corporate landscape amid many shifting factors, including a new Prime Minister, finalized tariff situation, currency volatility, and attractive valuation environment.
-
 Portfolio Perspective
Japan FundCompelling Japanese Opportunities Amid Attractive Valuations
 Masakazu Takeda, CFA, CMAPortfolio Manager
 Angus Lee, CFAPortfolio ManagerRead the Commentary
The Hennessy Japan Fund Portfolio Managers highlight the effect of the new Prime Minister on the economy and market and how holdings were affected by the final trade agreement. They also discuss currency volatility, valuations, and the most compelling opportunities as we end 2025.
-
 Investment Idea
Compelling Valuations in Japan
 Masakazu Takeda, CFA, CMAPortfolio Manager
 Angus Lee, CFAPortfolio Manager
 Tadahiro Fujimura, CFA, CMAPortfolio Manager
 Takenari Okumura, CMAPortfolio ManagerRead the Investment Idea
Japanese equities are currently trading at compelling valuation levels compared to other developed equity markets around the world and relative to their own historical averages. We believe the Japanese market deserves a closer look.
