Key Indicators of Banking Industry Health
Two key measures of the health of the banking industry have shown significant improvement and could point to continued solid profitability in the Financial sector in 2019 and beyond.
-
 David EllisonPortfolio Manager
 -
 Ryan C. Kelley, CFAChief Investment Officer and Portfolio Manager
Key Takeaways
- Bank failures have declined and loan quality has improved over the last decade.
- Banks have achieved solid levels of profitability while maintaining conservative levels of risk.
- New regulations and lending practices mean banks are potentially in a stronger position to weather the next downturn.
Key Bank Indicators
Two metrics, the number of bank failures and the ratio of non-performing loans to total loans, were watched closely during the last recession. They are just as indicative of conditions in the industry today as they were in 2009. So, what are they telling us about the state of the banking industry in 2019?
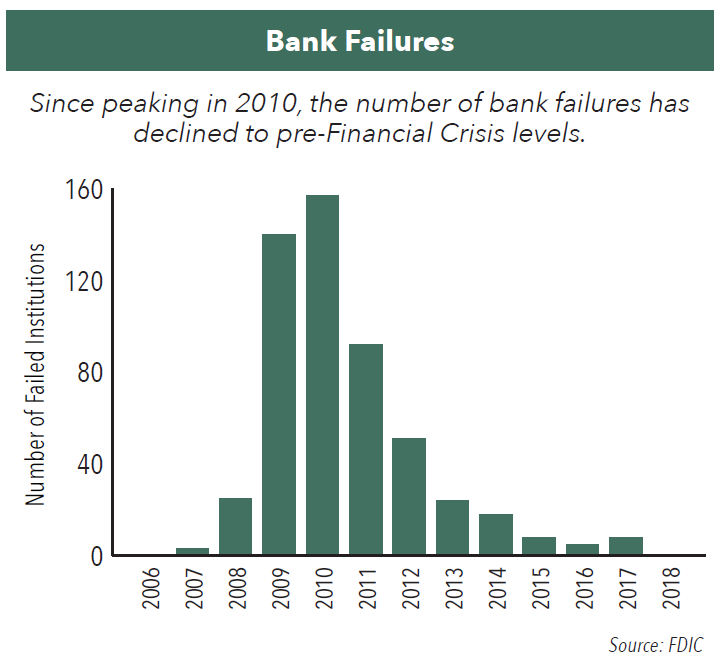
Bank Failures Have Declined
As the U.S. economy has staged a long recovery following the deep recession in 2008/2009, the number of bank failures has declined significantly, dropping from a peak of 157 in 2010 to just eight in 2017. During 2018, not a single bank failed.
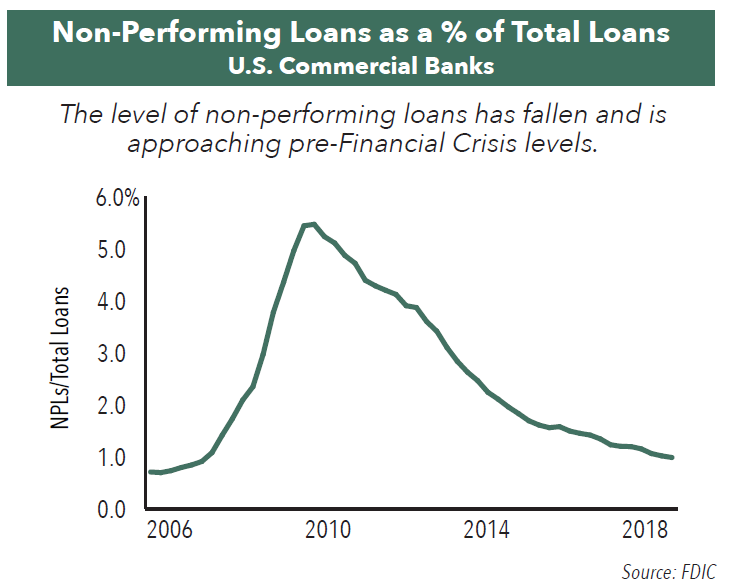
Loan Quality Has Improved
Non-performing loans (NPLs), or loans where the borrower is no longer paying interest or principal or both, have also declined precipitously over the last ten years. At the peak of the last recession, in the first quarter of 2010, NPLs for U.S. banks accounted for 5.5% of total loans. In the third quarter of 2018, NPLs accounted for just 1.0% of total loans.
These two indicators have charted the U.S. banking industry’s return to health following one of the worst cyclical downturns in its history. Both indicators are now consistent with levels seen during more “normal” periods of economic expansion, and they show an industry that has been operating at solid levels of profitability during the last four years of this economic expansion.
A Stronger Banking Industry Today
The slow but steady resumption of economic growth following the recession in 2008/2009 drove much of the recovery in the banking industry over the last decade. However, we believe a few factors in particular have helped put the industry in a stronger position than in the past, and have contributed to the banking industry’s ability to achieve rising rates of return on equity (12.4% in the third quarter of 2018 versus 7.9% in 2011), while maintaining conservative levels of risk.
1. Capital and Liquidity Requirements. Before the Financial Crisis, bank capital requirements were fairly loose. Some large financial institutions had leverage ratios of roughly 50 to 1 – in other words, they only had $1 in capital to protect against every $50 in loans. New government regulations now require the largest banks to hold up to 9.5% of their assets in cash and other liquid assets, meaning leverage ratios today are roughly 10 to 1, leaving banks in a much stronger position to weather the next downturn.
2. Credit Standards. In the residential mortgage market, the banks, working together with government agencies like Fannie Mae and Freddie Mac, have kept credit standards stable. Although low-deposit mortgage products are again available, the more high-risk variations have virtually disappeared, and the average American’s credit score is over 700, a level considered “solidly good.”
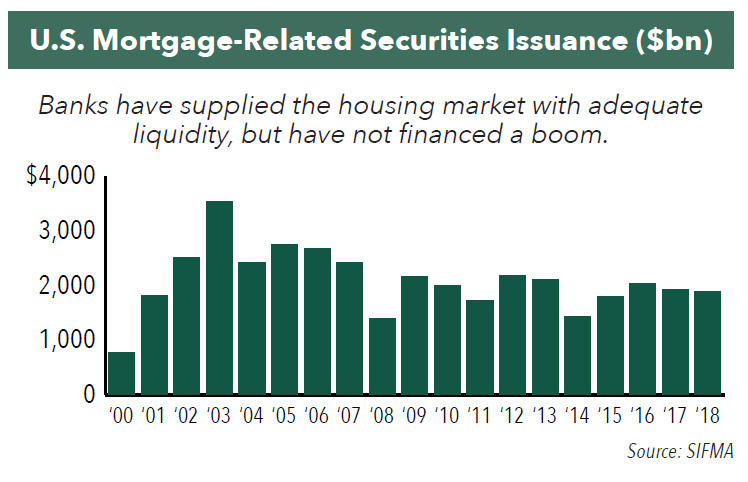
3. Mortgage Lending. Banks have kept the housing market supplied with liquidity since the Financial Crisis, but they have been careful not to increase lending too fast and risk facilitating a bubble in home prices, which might cause loan defaults to rise when it deflates. In illustration, the issuance of mortgage-related securities, an indicator of mortgage lending volume, was lower in 2018 than in all but four of the past 10 years.
4. Lower Corporate Debt. Corporations have deleveraged their balance sheets over the last decade, making it less likely that they will default on loans they do take out. For companies in the S&P 500 Index, total debt is still lower in dollar terms than it was in 2006, and as a percentage of total assets, it was just 25% at year-end 2018 compared with an average of over 37% in the seven years leading up to the Financial Crisis.
- In this article:
- Financials
- Small Cap Financial Fund
- Large Cap Financial Fund
You might also like
-
 Portfolio Perspective
Large Cap Financial FundSmall Cap Financial FundSolid Industry Fundamentals & Continued Consolidation
David EllisonPortfolio Manager
Ryan C. Kelley, CFAChief Investment Officer and Portfolio ManagerRead the CommentaryPortfolio Managers Dave Ellison and Ryan Kelley review 2025 bank performance, fintech-driven consolidation, attractive valuations, and their constructive 2026 outlook.
-
 Portfolio Perspective
Large Cap Financial FundSmall Cap Financial FundSeeking Innovation in the Financials Industry
David EllisonPortfolio Manager
Ryan C. Kelley, CFAChief Investment Officer and Portfolio ManagerRead the CommentaryPortfolio Managers Dave Ellison and Ryan Kelley discuss what’s driving performance in the Hennessy Large Cap Financial Fund, how tariff increases affect banks, the interest rate environment, and the opportunities in financials.
-
 Viewpoint
Navigating the Financial Landscape in 2025
David EllisonPortfolio ManagerWatch the VideoHennessy Funds Portfolio Manager Dave Ellison discusses the key drivers behind the financial sector's strong performance in 2024, the impact of potential rate cuts and regulatory changes, and the evolving landscape of banking in 2025. He also explores the challenges and opportunities facing both large and small banks, the role of AI, and the critical risks to watch, from traditional credit concerns to transformative technological shifts.