Attractively Valued Energy Companies with Financial Flexibility
Portfolio Manager Ben Cook, CFA discusses his thoughts on production and demand for the primary fuel mix, a continuation of buybacks and dividends in the Energy sector, and where the Fund is finding opportunity.
-
 Ben Cook, CFAPortfolio Manager
 -
 L. Joshua Wein, CAIAPortfolio Manager
Would you please discuss the expected growth in U.S. energy production and demand?
2022 was a significant year as a rebound in global energy demand post-pandemic combined with disruption in Russian energy supplies triggered volatility in energy pricing and ultimately a meaningful supply response particularly from the U.S. While we anticipate energy market volatility to subside during 2023, demand for energy should continue to expand on growing global GDP which is anticipated to rise by 2%. In this environment, we see global crude oil demand rising approximately 2% while natural gas demand should rise by approximately 3%.
Looking ahead, the long-term production growth rates of the primary fuel mix will vary. Renewables are expected to be the fastest growing category, annually compounding at 7-8% per year through end of this decade. Natural gas production is expected to rise 2-3% on an annual basis, crude oil production and nuclear power should be flat, while coal is expected to decline 3% per year.
Notably, the U.S. should see significant growth in liquefied natural gas (LNG) export capacity by 2030. The U.S. began exporting LNG in 2016, and by 2022, the U.S. had an export capacity of 13 billion cubic feet per day (Bcf/d). By the end of the decade, it could nearly double to 20 Bcf/d.
What are the expectations for buybacks and share repurchases in the Energy sector?
During 2022, there were numerous buyback and share repurchase announcements and 2023 appears to be a continuation of this shareholder friendly capital allocation trend.
Buybacks and dividends were significant: As a percentage of market capitalization since the beginning of 2022, the North American large-cap integrated group’s buybacks and dividends averaged 10% over the year. In 2023, the same set of companies could return 6-8% of market capitalization in dividends and share repurchases.
While lower than 2022, the figure is based on the expectation that these companies will experience reduced cash flow because of lower commodity prices. For example, in 2022, the price of a barrel of Brent crude oil averaged nearly $100; the market is expecting Brent crude oil to average $83/barrel in 2023, a 20% decline in price.
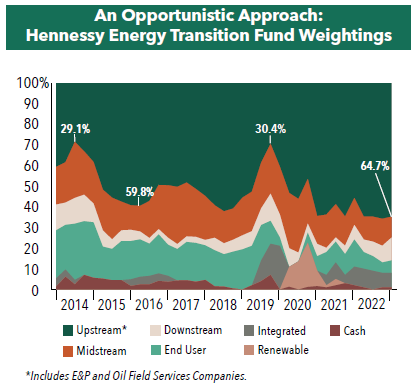
With the flexibility to invest across the energy spectrum where are you finding opportunities?
We believe the Upstream subsector, and more specifically the Oilfield Services (OFS) subsector represents one of the more attractive areas across the traditional hydrocarbon energy value chain. Fundamentals for many of these oil service companies have continued to improve amidst the strength in commodity prices and rising sector activity levels over the last several years.
While the natural gas market has softened with this year’s warmer winter weather, oil and natural gas demand should remain strong given the Eurozone’s need to make up for the loss in Russian natural gas volumes. Amidst the tightness in oilfield service equipment and labor supply, we see continued OFS company pricing power which should afford subsector companies with the ability to generate improving operating and financial results in the coming quarters.
Accordingly, with an opportunistic approach to invest across the entire energy “value chain” seeking the best balance of reward and risk, the Fund has increased its allocation to Oilfield Services companies. As of 12/31/22, nearly 25% of the Fund was allocated to companies in Oilfield Services—the highest in the Fund’s history.
Would you please discuss current valuations following a strong 2022 for the Energy sector?
The Energy sector currently looks attractively priced on a free cash yield basis, which considers cash availability beyond capital expenditures and dividends. U.S. major companies are expected to generate a free cash yield in the high single digit percentage range; and U.S. exploration and production companies are expected to generate a free cash yield of approximately 10%.
Further, sector free cash yields compare favorably to the broader market. As of 12/31/22, the free cash yield of the S&P 500 Energy Index on 2023 estimated free cash levels was approximately 8.7%, while the free cash yield of the S&P 500 Index on estimated 2023 free cash levels was approximately 4.2%.
Current valuations for Energy stocks also screen attractively when viewed in the context of their own historical valuation range. As of 12/31/22, the S&P 500 Energy Index traded at approximately 5.6x on an Enterprise value to estimated forward 12 month EBTIDA basis, well below the historical 10 year average of approximately 7.8x estimated forward 12 months EBITDA.
- In this article:
- Energy
- Energy Transition Fund
You might also like
-
 Portfolio Perspective
Midstream FundPotential Natural Gas Tailwinds for Midstream Companies
Ben Cook, CFAPortfolio Manager
L. Joshua Wein, CAIAPortfolio ManagerRead the CommentaryThe following commentary highlights how recent events in Venezuela affect midstream investors, how midstream companies could benefit from interest rate cuts, rising natural gas and LNG demand, and AI-driven efficiencies, while maintaining disciplined capital allocation, strong shareholder returns, and attractive valuations.
-
 Portfolio Perspective
Energy Transition FundThe Role of Natural Gas to Meet AI Energy Demand
Ben Cook, CFAPortfolio Manager
L. Joshua Wein, CAIAPortfolio ManagerRead the CommentaryIn the following commentary, Portfolio Manager Ben Cook and Josh Wein highlight the Fund’s 2025 outperformance, discuss the impact the events in Venezuela may have on the energy sector, and outline key 2026 Energy sector opportunities.
-
 Portfolio Perspective
Gas Utility FundNatural Gas Utilities as a Potential Growth Story
 Ryan C. Kelley, CFAChief Investment Officer and Portfolio Manager
L. Joshua Wein, CAIAPortfolio ManagerRead the Commentary
Ryan C. Kelley, CFAChief Investment Officer and Portfolio Manager
L. Joshua Wein, CAIAPortfolio ManagerRead the CommentaryWith AI-driven power demand, rising capital investments, LNG growth, and pipeline infrastructure expansion, natural gas utilities are being repositioned as potential growth stories with attractive valuations and dividends.