Seeking Attractive Valuations and High Profitability
In the following commentary, the Portfolio Managers of the Hennessy Cornerstone Large Growth Fund discuss the Fund’s formula-based investment process and how it drives the Fund’s sector and industry positioning.
-
 Neil J. HennessyChief Market Strategist and Portfolio Manager
 -
 Ryan C. Kelley, CFAChief Investment Officer and Portfolio Manager
 -
 L. Joshua Wein, CAIAPortfolio Manager
What is the Hennessy Cornerstone Large Growth Fund’s investment strategy?
The Fund utilizes a formula-based approach to build a portfolio of attractively valued, highly profitable, larger-cap companies. In essence, the strategy seeks high quality, high return companies that may be overlooked by investors.
From the universe of stocks in the S&P Capital IQ Database, the Fund selects the 50 stocks with the highest one-year return on total capital which also meet the following criteria, in the specified order:
» Above-average market capitalization
» Price-to-cash flow ratio less than the median of the remaining securities
» Positive total capital
Why does the Fund use these screening criteria?
Larger market capitalization companies tend to be well-established leaders in their industries with long, successful track records and solid profitability.
A low price-to-cash flow ratio can be a good indicator of attractive stock valuation. Positive cash flow tends to be associated with companies with profitable business models.
The use of positive total capital as a screening criterion helps the Fund avoid financially weaker companies.
Why does the formula select stocks with the highest one-year return on total capital?
From among the companies that meet the screening criteria, the Fund selects the 50 with the highest one-year return on total capital. We believe return on total capital is an excellent measure of a company’s profitability and is often associated with strong management, high barriers to entry, and other favorable factors. As a result, we believe this measure can help uncover stocks with the potential to outperform the market.
How does the Fund seek to provide a return to investors?
We believe the Fund’s investments present the potential for capital appreciation when and if market sentiment changes and their valuations rise. Strong profitability has the potential to lead to earnings growth, which could also drive capital appreciation.
How often does the Fund rebalance its portfolio?
The universe of stocks is re-screened, and the portfolio is rebalanced annually, generally in the winter. Holdings are weighted equally by dollar amount with approximately 2% of the Fund’s assets invested in each at the end of the rebalance.
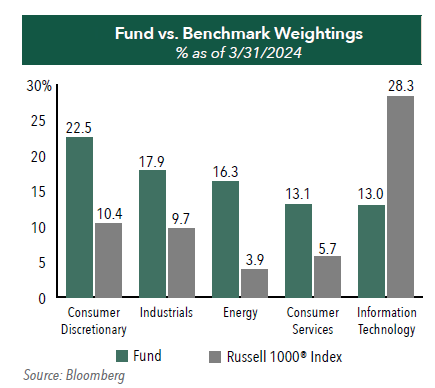
How does the Fund’s portfolio differ from its benchmark?
Compared to its benchmark, the Russell 1000® Index, the Fund is most significantly overweight the Energy and Consumer Discretionary sectors. In addition, the Fund is diversified across 9 of the 11 GICS sectors, with the exception of Real Estate and Utilities.
While the economic outlook both in the United States and globally continues to be positive in this high interest rate and high inflation environment, we note that many of our portfolio companies could benefit from anticipated declining rates and continued economic growth. Many holdings in the Energy sector could continue to benefit from higher overall commodity prices, while increased services could benefit our Consumer Discretionary holdings.
Of note, the Fund’s largest concentration, Consumer Discretionary and Consumer Staples, increased significantly compared to last year. We attribute this to improving valuations given a solid economy and resilient consumer spending over the past year, with valuations typically becoming more attractive and therefore ripe for inclusion in the Fund.

- In this article:
- Domestic Equity
- Cornerstone Large Growth Fund
Return on capital is a ratio measuring the profitability of a firm expressed as a percentage of funds acquired from investors and lenders. Russell® is a trademark of Russell. Neither Russell nor its licensors accept any liability for any errors or omissions in the Russell Indexes or Russell ratings or underlying data, and no party may rely on any Russell Indexes or Russell ratings or underlying data contained in this communication. No further distribution of Russell data is permitted without Russell’s express written consent. Russell does not promote, sponsor, or endorse the content of this communication.
You might also like
-
 Fund Commentary
Cornerstone Growth FundA Fund Focused on Valuation, Growth and Momentum
Ryan C. Kelley, CFAChief Investment Officer and Portfolio Manager
L. Joshua Wein, CAIAPortfolio ManagerRead the CommentaryIn the following commentary, the Portfolio Managers of the Hennessy Cornerstone Growth Fund discuss the Fund’s formula-based investment strategy and how it drives the Fund’s sector and industry positioning.
-
 Company Spotlight
Focus FundAST SpaceMobile: Transforming How the World Connects
 David Rainey, CFACo-Portfolio Manager
 Brian Macauley, CFACo-Portfolio Manager
 Ira Rothberg, CFACo-Portfolio ManagerRead the Spotlight
AST is building the first and only space-based cellular broadband network accessible directly by everyday smartphones with both commercial and government applications. With strategic investments from leading technology players such as AT&T, Verizon, Vodafone and Google, AST has the bold goal to provide uninterrupted broadband connectivity, everywhere.
-
 Fund Commentary
Focus FundRecognizing the Future Earning Power of High-Quality Businesses
David Rainey, CFACo-Portfolio Manager
Ira Rothberg, CFACo-Portfolio Manager
Brian Macauley, CFACo-Portfolio ManagerRead the CommentaryThe Portfolio Managers discuss adding to positions in the first quarter, assess geopolitical impacts on holdings, review AST SpaceMobile developments, and highlight opportunities in a market shaped by factor-driven flows and short-term narratives.