Natural Gas Drivers in 2021 and Beyond
The Portfolio Managers of the Hennessy Gas Utility Fund discuss the trillion-dollar Infrastructure Bill, natural gas production, demand, and exportation, and the composition and dividend growth of the Fund.
-
 Ryan C. Kelley, CFAChief Investment Officer and Portfolio Manager
 -
 L. Joshua Wein, CAIAPortfolio Manager
What does the trillion-dollar Infrastructure Bill mean for natural gas utilities?
Many elements within the U.S.’s $1 trillion Infrastructure Bill could benefit natural gas utilities either directly or indirectly. A few components include:
1. Pipeline Safety – $1 billion is earmarked for the “Natural Gas Distribution Infrastructure Safety Modernization Grant Program” to modernize natural gas distribution pipelines. Additional infrastructure improvement spending should drive utilities’ earnings growth as state regulators generally allow companies to make a return on these investments.
2. Grid Modernization – The Bill proposes $11.6 billion in funding for technology, including transmission lines to augment the grid’s reliability, resilience, and flexibility. In addition, $1 billion would be allocated in the next five years to modernize and improve the rural grid’s resilience.
3. Electric Vehicles – The Bill promotes a shift toward electric vehicles (EVs) and targets $7.5 billion for building EV charging stations and related infrastructure and $6 billion to promote and advance battery manufacturing. Increasing numbers of EVs should positively impact natural gas demand as the commodity is a primary source of electric power generation.
Would you please discuss current natural gas production and demand dynamics?
Natural gas has proven to be resilient with plenty of production and only a small decrease in domestic demand since the beginning of the pandemic. Production of natural gas in the U.S. is on pace to set an annual all-time high, currently at 92.6 billion cubic feet per day (Bcf/d). In 2022, natural gas production is expected to reach a new record, climbing to
94.7 Bcf/d.1
This summer’s warmer-than-average temperatures have driven higher prices and increased usage of natural gas. In March 2021, natural gas was about $2.60 per million British thermal unit (MMBtu) and rose to about $4.15 per MMBtu by August 2021. Gas volumes for July were well above 2020 levels, up almost 2 to 3% over the prior year’s period.
U.S residential/commercial and industrial demand is currently above 2020 levels. Globally, demand for natural gas is on pace to rise 3.2% in 2021 versus 2020 levels, which is about 1% above 2019 levels.
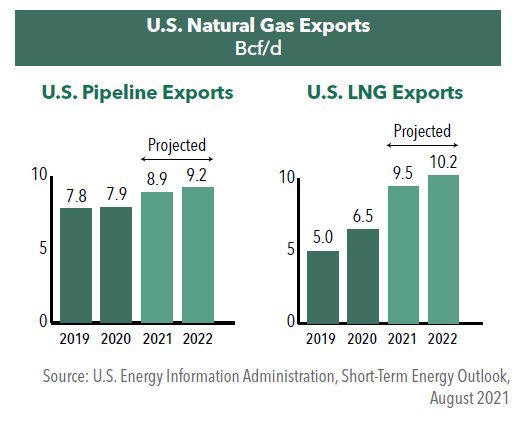
How is exportation driving natural gas demand?
Natural gas exports from the U.S. are currently soaring. Exports via U.S. pipelines to Mexico as well as global liquefied natural gas (LNG) exports have increased significantly and are at record levels. The rise in natural gas demand from Mexico has been primarily driven by additional pipeline capacity that enables more natural gas to flow through the system. In June, exports to Mexico via pipelines were 25% higher than a year ago.
The U.S. is quickly catching up to the two largest LNG exporters in the world, Australia and Qatar. According to the EIA, U.S. exports of LNG in 2021 will be double that of pre-pandemic levels in 2019. The U.S. is currently exporting approximately 60% of Australia’s and Qatar's volumes combined. The large spread in global LNG prices is causing a significant spike in demand. Currently, LNG in Europe and Asia is above $14-15/MMBtu, significantly higher than in the U.S. where natural gas is about $4.
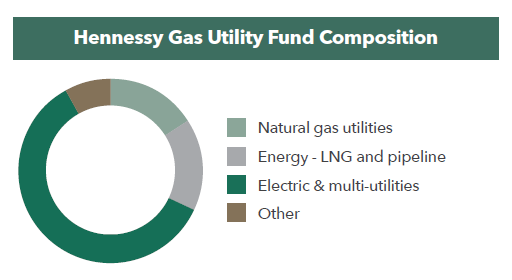
What is the current composition of the Hennessy Gas Utility Fund?
The Fund is primarily divided into three categories: electric and multi-utilities (60%). pure play natural gas utilities (16%), and Energy sector companies which includes LNG and major pipeline companies (16%). The Fund maintains significantly more concentration in natural gas distribution companies than other utility funds. As a result of acquisition activity of natural gas assets over the years, our holdings have moved more heavily into the diversified/multi-utilities sector. In January 2021, water utility company, Essential Utilities, was added to the Fund. They acquired a natural gas utility and became a member of the American Gas Association.
Two thirds of portfolio companies generate a portion of their total electricity from renewables including hydro, solar, and wind. In addition, 11 out of the 48 Fund holdings have some exposure to nuclear energy.
What is the dividend growth of the Fund?
Over the last three years, the overall dividend growth rate for the companies in the Fund averaged 4.4% per year, close to its historical rate. The one-year average dividend growth rate was a little lower at 3%, however, some companies were growing their dividends at 8-10%. Importantly, dividend growth of portfolio companies has been driven by growth in earnings.
As of 7/31/21, 44 of the Fund’s 48 holdings pay a dividend, with an average yield of 3.5%.2
- In this article:
- Energy
- Gas Utility Fund
You might also like
-
 Portfolio Perspective
Midstream FundPotential Natural Gas Tailwinds for Midstream Companies
 Ben Cook, CFAPortfolio Manager
L. Joshua Wein, CAIAPortfolio ManagerRead the Commentary
Ben Cook, CFAPortfolio Manager
L. Joshua Wein, CAIAPortfolio ManagerRead the CommentaryThe following commentary highlights how recent events in Venezuela affect midstream investors, how midstream companies could benefit from interest rate cuts, rising natural gas and LNG demand, and AI-driven efficiencies, while maintaining disciplined capital allocation, strong shareholder returns, and attractive valuations.
-
 Portfolio Perspective
Energy Transition FundThe Role of Natural Gas to Meet AI Energy Demand
Ben Cook, CFAPortfolio Manager
L. Joshua Wein, CAIAPortfolio ManagerRead the CommentaryIn the following commentary, Portfolio Manager Ben Cook and Josh Wein highlight the Fund’s 2025 outperformance, discuss the impact the events in Venezuela may have on the energy sector, and outline key 2026 Energy sector opportunities.
-
 Portfolio Perspective
Gas Utility FundNatural Gas Utilities as a Potential Growth Story
Ryan C. Kelley, CFAChief Investment Officer and Portfolio Manager
L. Joshua Wein, CAIAPortfolio ManagerRead the CommentaryWith AI-driven power demand, rising capital investments, LNG growth, and pipeline infrastructure expansion, natural gas utilities are being repositioned as potential growth stories with attractive valuations and dividends.