Market Commentary and Fund Performance
Masa Takeda of Tokyo-based SPARX Asset Management Co., Ltd., sub-advisor to the Hennessy Japan Fund, shares his insights on the Japanese market and Fund performance.
-
 Masakazu Takeda, CFA, CMAPortfolio Manager
Fund Performance Review
For the month of March, the Hennessy Japan Fund (HJPIX) declined 3.45% while the Russell Nomura Total Market™ Index lost 0.81% and the Tokyo Stock Price Index (TOPIX) fell 1.03%.
Among the best performers were our investments in Mitsubishi Corporation, the largest trading company in Japan, Recruit Holdings Co., Ltd., Japan’s unique print and online media giant specializing in classified ads as well as providing human resources services, and Sony Corporation, a diversified consumer and professional electronics, gaming, entertainment and financial services conglomerate.
Click here for full, standardized Fund performance.
As for the laggards, Mercari,Inc., an operator of “Mercari”, a flea market application having accumulated one hundred million of downloads, Nitori Holdings Co., Ltd., the top manufacturing and retail chain of furniture and interior goods, and Rohto Pharmaceutical, a leading skincare cosmetics and over-the-counter ophthalmic medicines producer, detracted from the Fund’s performance.
In stock investment, in order to meaningfully outperform the index through a long holding period, you need to be able to do two things successfully. First, identify a business which will grow at an above-average rate (i.e. GDP growth rate) for many years. Second, invest in such a stock at an attractive valuation level such that there is also potential for valuation multiple expansion as an added bonus. Although in theory, no business can grow faster than GDP growth rate forever and no stock can rise faster than earnings growth perpetually, we empirically know that there have been many cases where the stock enjoyed the double effect of faster-than-average profit growth and re-rating for an extended period of time. In fact, the duration can be a lot longer than average market participants realize. This is why some of the greatest investment performances have been achieved by buy-and-hold investors. It is also encouraging to know that there are many publicly listed, decades-old companies around the world whose share prices continue to hit all-time highs even today. They came through the stagflation period of the ‘70s and ‘80s accompanied by much higher interest rates, not to mention the many other challenges such as wars, natural disasters, financial and economic crises and so on. This is why we pay particular attention to valuation upon entry and adopted a buy-and-hold approach. As they say, “Time is the friend of the wonderful business.”
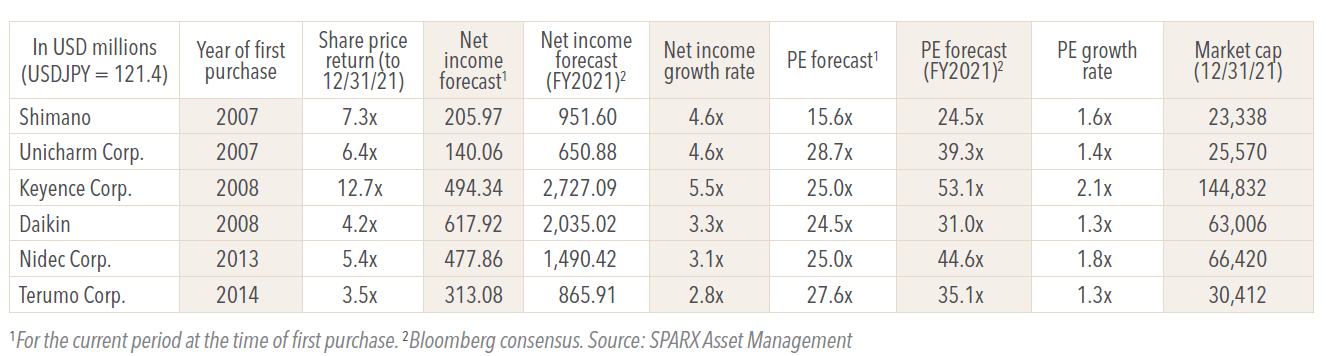
That being said, the Fund did go through gradual “rebalancing” over the years. The Fund’s typical annual turnover is around 10%, which means roughly half of the portfolio has changed in the last 5 years. The table above lists some of the Fund’s long-term holdings purchased between 2007 and 2014 with an average holding period of around 10 years showing how much of their cumulative share price appreciation is attributable to profit growth and re-rating.
In recent years, the Fund’s aggregate exposure to these high growth and price to earnings (PE) multiple names have gone down in favor of other equally compelling growth stocks but with more attractive valuations. Here are some of the major investments we made after 2015. It is worth noting that we have made some mistakes along the way, like our investment in Japan Tobacco, which proved to be a dud despite the attractive valuation and dividend yield.
• Calendar Year (CY) 2015: SoftBank Group3 (13x forward PE at the time of our purchase vs the Fund’s average forward PE of 20x)
• CY2016: Recruit (17x forward adjusted PE at the time of our purchase vs the Fund’s average forward PE of 18x)
• CY2019/2020: Sony Group (13x forward PE at the time of our purchase vs the Fund’s average forward PE of 21x)
• CY2021: Hitachi (10x forward PE at the time of our purchase vs the Fund’s average forward PE of 27x)
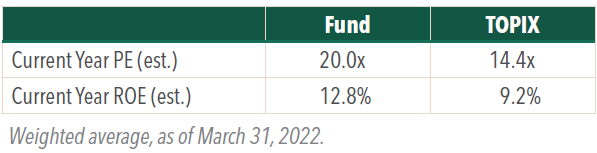
Thanks to these new investments combined with continued earnings growth of our old investees and the recent share price correction overall, the Fund’s valuation premium over the market average has narrowed in Q1 of 2022. Back in November 2021, the Fund’s average PE was hovering around 55% above that of the TOPIX. Today it is about 39% higher. Considering the quality advantages of our holdings, we believe that the Fund’s valuation is becoming increasingly attractive. It is always worth reiterating that the Fund’s holdings are trading at a premium to the market average but they are not trading at a premium to their own intrinsic value in our view. It is difficult to say how much premium should be deserved but given the higher returns on capital (e.g. the Fund’s return-on-equity (ROE) vs the market average ROE) and long growth runway ahead, the Fund’s holdings should trade at higher multiples.
In quest for Japan’s future market cap leader
Looking back on the 15-year history of the strategy, you will notice that the Fund has added its existing holdings one by one over the years. Today, nine of the Fund’s holdings are ranked among the 30 largest market cap companies in Japan, and we are proud of this. For instance, Keyence was only the 60th largest market cap company back in 2008 when we started investing in the stock with relatively low name recognition. Fourteen years on, the company has become the third largest by market cap only behind Toyota and Sony Group.
Our deliberate focus on identifying the future Japanese market cap leaders is inspired by academic studies we came across a few years ago. According to “Do Stocks Outperform Treasury Bills?” and “Do Global Stocks Outperform U.S. Treasury Bills?” published by finance professor Hendrik Bessembinder, it was discovered that the long-term cumulative wealth created on the stock market can be attributed disproportionately to a handful of stocks. For instance, in the U.S., out of the nearly 26,000 listed companies that existed between 1926 and 2016, only about 4% of the firms accounted for all of the net market gains of nearly $35tn. In the case of foreign stock markets, less than 1% of the firms were responsible for the $16tn wealth created between 1990 and 2018. Such skewness is astonishing but it highlights the importance of investing in the right companies and holding onto them through thick and thin in order to achieve successful investment performance as an active manager. To that end, in addition to the moats and prospects for strong growth, we also contemplate the potential for the business to become “big” based on the size of the addressable market the company operates in (or may enter in the future). This helps us to be outside-the-box thinkers and take a truly long-term perspective on companies, which results in a high-active share portfolio, an important pre-requisite to meaningful outperformance over the index. It also justifies that, in a mature and not so populous country like Japan, investing in stocks of international companies is essential.
One interesting phenomenon or lack thereof is that Japan has not seen a new market cap leader in a long while. Toyota, the world’s largest car maker, has been sitting at the top of the leaderboard for the last two decades. The problem is that Toyota’s revenue, profit and market value have stagnated since the pre-2008 peak. This speaks to Japan’s lackluster corporate sector dynamism. Meanwhile, in Taiwan and Korea where population sizes are smaller than Japan hence domestic consumer base is also limited, TSMC and Samsung have become global tech heavyweights, and they have each compounded their profits sevenfold since before the 2008 crisis. As such, both companies have been not only the dominant market cap leaders in their respective countries but also extended their lead further.
Below is a table highlighting some of the overseas corporate superstars who handily overtook Toyota in market cap over the last 15 years.
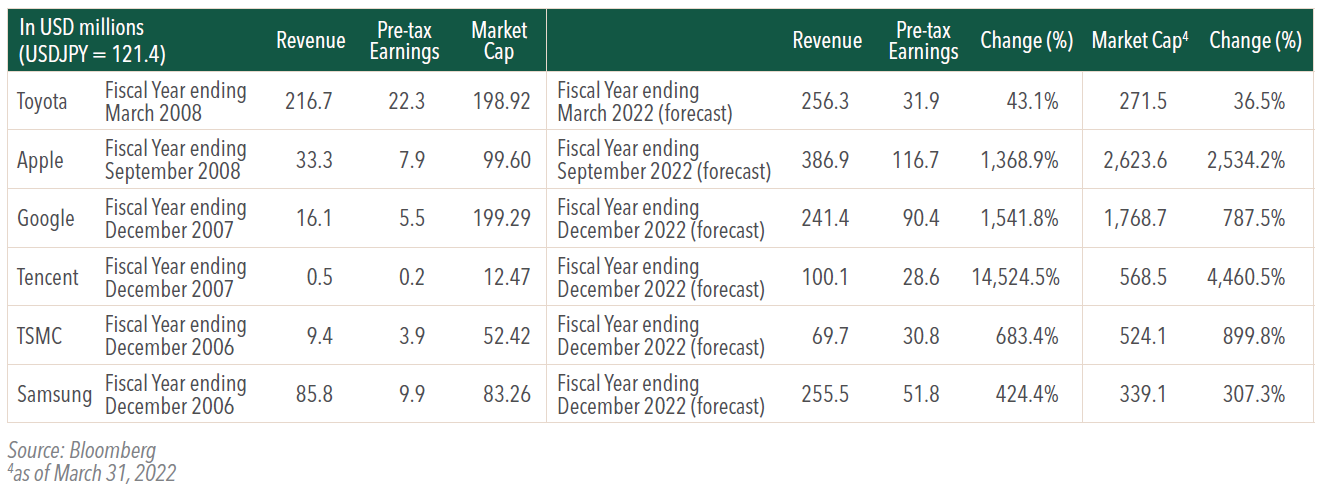
As you can see, the key driver behind the rapid ascent in share price for these global titans is not entirely the expansion of PE multiples but rather significant increases in earnings. Our hope is that someday Japan will have a new corporate superstar, and to that end, the potential scale of profits of the Fund’s investees matters. Toyota, even though it has only grown by roughly 40% since fiscal year 2007 (CAGR of 2.6%), still boosts a pretax profit of around JPY 3.9tn yen ($32bn), no small feat. Contrary to this, Sony Group, one of the Fund’s core holdings which has moved up the market cap ladder to become the second runner-up, is expected to post around $10bn in profit before tax (PBT) this fiscal year, a far cry from the auto giant. Hitachi, the century-old manufacturing conglomerate which is on the cusp of transforming into data-analytics based industrial solution provider, is looking to deliver around $7bn in PBT and management wants to raise it to 1tn yen ($8.3bn) as an interim target. Elsewhere, Mitsubishi Corp’s profit size should not be overlooked as its PBT is expected to top $10bn this year albeit owing to strong commodity prices of late. Keyence, Recruit, and NIDEC have yet to exceed $5bn but these are faster compounding businesses with expanding addressable markets. SoftBank Group may one day generate tens of billions of dollars in profit repeatedly if the Vision Fund business becomes the real growth engine for the company. In any event, these are some of the candidates which may have a shot at claiming the title of Japan’s largest market cap at some distant point in the future in our view.
Click here for a full listing of Holdings.
- In this article:
- Japan
- Japan Fund
1 For the current period at the time of first purchase
You might also like
-
 Portfolio Perspective
Japan Small Cap FundJapanese Small-Caps’ Earnings Resilience and Improving Returns on Capital
 Takenari Okumura, CMAPortfolio Manager
 Tadahiro Fujimura, CFA, CMAPortfolio ManagerRead the Commentary
In the following commentary, the Portfolio Managers cover small-cap outperformance drivers, pro-growth fiscal policy, governance reform, yen volatility, portfolio repositioning, profitability and capital efficiency trends, valuation gaps, and their 2026 outlook.
-
 Portfolio Perspective
Japan FundA Differentiated Portfolio Focused on Margin of Safety and Upside Potential
Masakazu Takeda, CFA, CMAPortfolio Manager Angus Lee, CFAPortfolio ManagerRead the Commentary
The Portfolio Managers summarize the significant events that drove markets over 2025 and how the Fund remains focused on quality, capital discipline, and valuation, with a clear preference for stock picking over index exposure.
-
 Investment Idea
Compelling Valuations in Japan
Masakazu Takeda, CFA, CMAPortfolio Manager
Angus Lee, CFAPortfolio Manager
Tadahiro Fujimura, CFA, CMAPortfolio Manager
Takenari Okumura, CMAPortfolio ManagerRead the Investment IdeaJapanese equities are currently trading at compelling valuation levels compared to other developed equity markets around the world and relative to their own historical averages. We believe the Japanese market deserves a closer look.