Market Commentary and Fund Performance
Masa Takeda of Tokyo-based SPARX Asset Management Co., Ltd., sub-advisor to the Hennessy Japan Fund, shares his insights on the Japanese market and Fund performance.
-
 Masakazu Takeda, CFA, CMAPortfolio Manager
Performance data quoted represents past performance; past performance does not guarantee future results. The investment return and principal value of an investment will fluctuate so that an investor’s shares, when redeemed, may be worth more or less than their original cost. Current performance of the fund may be lower or higher than the performance quoted. Performance data current to the most recent month end, and standardized performance can be obtained by viewing the fact sheet or by clicking here.
Fund Performance Review
In December, the Fund increased 5.19% (HJPIX), outperforming its benchmark, the Russell/Nomura Total MarketTM Index, which rose 3.93%.
The month’s positive performers among the Global Industry Classification Standard (GICS) sectors included shares of Materials, Industrials, and Financials while Communication Services, Consumer Discretionary, and Health Care detracted from the Fund’s performance.
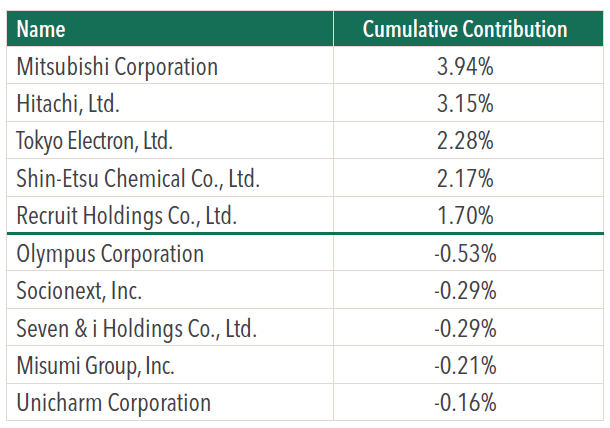
Among the best performers were our investments in Shin-Etsu Chemical Co., Ltd., Japan’s largest chemical company, Recruit Holdings Co., Ltd., Japan’s unique print & online media giant specializing in classified ads as well as providing HR services, and Tokyo Electron Limited, a manufacturer of semiconductor equipment.
As for the laggards, Rohto Pharmaceutical Co., Ltd., a leading skincare cosmetics and over-the-counter ophthalmic medicines producer, ASICS, the high performance running shoes maker and Fast Retailing Co., Ltd., the operator of “UNIQLO” brand casual wear stores were the largest detractors.
For calendar year (CY) 2023, the top five and bottom five contributors to the Fund performance were as follows:
We would like to give an update on Hitachi and Mitsubishi Corp (we haven’t discussed them for a while) and an introduction to Socionext.
Hitachi
The situation at Hitachi, which we introduced in detail as a new investment in the July 2021 letter, has been progressing largely as we predicted. Since our first purchase, we quickly made it one of the largest fund holdings and the stock price has appreciated 63.24% since the end of CY2021. So far so good.
It is said that the Lumada business, which started in 2016, was initially perceived as an opaque business concept, even within the company itself. We view Lumada not as a business dependent on specific technologies or software, but as a “business brand” that generates revenue by proposing solutions that utilize all available resources within the company, shifting it from a traditional hardware sales model to one that includes everything from consulting, manufacturing, to after-sales service. The credit for developing this concept goes to the late President Nakanishi, who sadly passed away in 2021.
While the company has a wide business portfolio, it does not possess a dominant share in most product categories. However, being a conglomerate enables Hitachi to utilize its expertise in Information Technology (IT) services, mission-critical social infrastructure operations, and manufacturing across various fields. The range of internal resources has expanded through the reorganization of the group over the past decade, which included acquisitions of new assets such as GlobalLogic and Hitachi Energy (formerly ABB). Another key point is that the business portfolio was re-oriented to cater towards growing business domains such as DX and GX.
Interestingly, we’ve recently begun to see similar strategies from other general electronic manufacturers in Japan. Mitsubishi Electric is promoting a business model that collects and analyzes data generated by industrial customers using Mitsubishi Electric’s components/systems to provide solutions for them. Fujitsu is also pursuing a business model called Uvance which aims to identify societal issues and target various industries including retail, healthcare, and manufacturing with SX (sustainability transformation) solutions.
However, we believe Hitachi is already a few steps ahead as it defined differentiated focus areas more than a decade ago such as power infrastructure (transmission networks) and railway systems and has made heavy investments in them.
In terms of financial strategy, Hitachi management’s key performance indicators (KPI) have completely changed compared to a decade ago. They are now focusing on growth (earnings per share growth), capital efficiency (return on invested capital - ROIC), and cash flow (free cash flow (FCF) conversion rate). This is a move in the right direction. In particular, ROIC has been increasingly adopted by many publicly listed Japanese companies in the last few years. Because return on equity (ROE) has shortcomings in that it can be influenced by the company’s financial leverage strategy and tax system in the jurisdiction where it is domiciled, we also agree that ROIC and return on capital employed (ROCE) are more appropriate as measures of a business’s quality.
Turning to the results for FY2023H1, sales were 3.92 trillion yen ($26.5 billion) - up 12% YoY, adjusted EBITA was 359.6 billion yen ($2.4 billion) - up 49.2 billion yen ($332 billion) YoY, and adjusted EBITA margin was 8.1% (up 0.8 pts YoY), showing steady performance. The order backlog was very robust, with about 1.5 trillion yen ($10.1 billion) in the Digital Systems & Services segment and about 3.9 trillion yen ($26.3 billion) at Hitachi Energy. The Lumada business is also expanding nicely, projected to account for 29% of total sales and 41% of adjusted EBITA for FY2023.1
As Hitachi already has all the “necessary pieces” in place for growth, the extent to which they can continue to accumulate new orders and how well they can convert the backlog into sales and profits will depend on the execution of the management team. If done successfully, we believe it could lead not only to significant profit growth but also to an increase in stock price valuation.
Mitsubishi Corporation
Regular readers of our letters would know that we view Mitsubishi Corporation and other general trading houses, the first large Japanese publicly listed equity investments ever made by Warren Buffett,2 as investment companies even though they trace their roots in wholesale trading. After many years of investment activities which leveraged on its expertise as a general trading house, the firms’ balance sheets today represent a unique collection of operating businesses, operating assets and investment securities with a wide variety of geographical exposure and industries that are not easily accessible through other means of investments. Their assets span globally: natural commodity project in Australia, truck assembly supply chain business in Southeast Asia, renewable energy power generation business in Europe and the U.S., convenience store operation in Japan and so on.
On the income statement, these general trading companies generate returns through 1) operating businesses (i.e. operating income), 2) dividends from investees, 3) equity income from affiliates, 4) realized gains from sale of investment securities and other fixed assets, 5) unrealized gains on investment securities (i.e. “gains on other investments designated as ‘FVTOCI’”), and 6) unrealized forex gains on foreign currency-denominated overseas assets (i.e. “exchange differences on translating foreign operations”). As such, conventionally focusing on net income does not give you a clear picture of how the company fared in a given year as some profit items do not pass through net income but are only reflected in the OCI (Other Comprehensive Income). For an investment house, we are of the view that these profit items are just as important (they will become “real” gains once the investment is exited).
In terms of how we evaluated the growth of its intrinsic value before the share buybacks that have become more common in recent years, we would simply look at the increase in book value per share (bps) as a proxy (considering dividend payouts) which reflected the results of comprehensive income.
Based on this, Mitsubishi Corp. grew consistently at a pace of high single digits to around 10% annually over the long term. Said differently, the company was not a “value stock” with no growth but was an above-average capital compounder that traded at value-stock-like valuations (or a “growth stock in disguise”). This is the reason why we have been a long-term shareholder of the company since the 2000s.
Mitsubishi Corp. is currently in “Midterm Corporate Strategy 2024” and management has been making satisfactory progress. As of FY2023Q2, approximately 650 billion yen ($4.4 billion) in surplus cash has been generated cumulatively after dividends and share buybacks are considered.3 While this is largely due to the recent boom in natural commodities, it indicates that management is comfortably ahead of its plan with the extra financial resources that can be allocated towards further investments and shareholder returns.
The cash flow allocation plan during the Midterm Corporate Strategy 2024 calls for 1.2 trillion yen ($8.1 billion) in renewable energy, and about 0.8 trillion yen ($5.4 billion) in DX and other growth areas.4 Given that these projects are long-term in nature, it will take time for earnings to fully ramp up. Hence, although the firm’s earnings also depend on the market conditions of the resource business, we would expect the overall baseline growth rate to be in the mid-single digits assuming a return on investment (ROI) of 10% for the new growth investments.
Meanwhile, the outlook for the company’s coking coal business appears promising. Coking coal is a raw material for steel manufacturing, and India is expected to be the biggest driver of global steel demand. Currently, China is the largest crude steel producer at 1 billion tons annually accounting for 54% of the world’s output.5 However, India as a key member of the “Global South” is expected to see steel production capacity increase to about 300 million tons by 2030 (up from 125 million tons in 2022).6 High-grade coking coal produced by Mitsubishi’s Australian joint venture BMA (with BHP Group) is becoming increasingly important in reducing the environmental impact of the steel industry. Availability of high-grade coking coal is limited and can only be found in Australia and North America with BMA controlling the largest share of seaborne trade. Considering the trend towards decarbonization, it is difficult to advance new coal development projects. As such, the supply situation is likely to remain tight. Furthermore, between coking coal and iron ore, another key ingredient in steel making, the former has better prospects. India depends heavily on imports for coking coal while being self-sufficient in iron ore (whereas China is self-sufficient in coking coal but not in iron ore). For this reason, we favor Mitsubishi Corp. over Mitsui Corp., another trading house, and a major producer of iron ore.
Today all general trading companies use ROE as a KPI. However, we believe this is not entirely appropriate. ROE is calculated by dividing the net income (“Profit for the year”) by shareholders’ equity (“Total equity”). It is intended to tell you how much profit is produced on the capital attributable to the shareholders. The problem is that the net income does not include changes in OCI under IFRS as explained above. The total equity, on the other hand, takes into account the comprehensive income for the year. This means that, in the conventional ROE formula, the numerator is not measured against the denominator on the same basis, and therefore the metric is not very meaningful for general trading companies, where there is a tendency for a significant difference between net income and comprehensive income. To illustrate, when the value of overseas assets increases due to a strong foreign currency, or when unrealized gains increase due to a rise in the value of investment securities, it will optically lead to a decrease in ROE. In our opinion, these gains should be considered in the calculation of ROE.7
The table below shows the two types of ROE for the five major general trading companies in FY2022:
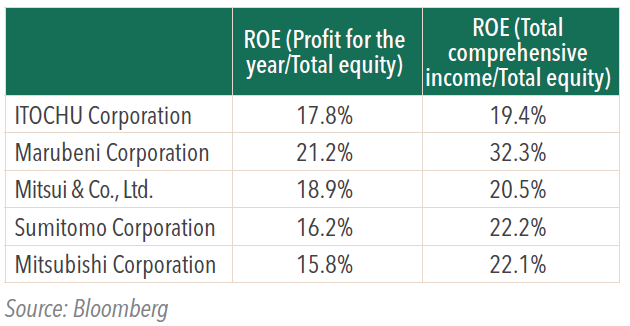
Looking at this, we can see that Mitsubishi Corp’s true ROE was 22.1%, much higher than the 15.8% that its management uses in its earnings presentation. As a side note, Marubeni had the highest ROE among the five players when calculated by total comprehensive income/total equity for the last two consecutive years. Until recently, Marubeni was thought to be lagging its competitors in terms of balance sheet strength (equity ratio), but, with the real ROE exceeding 30%, the company has built up equity faster than its peers. Thus, Marubeni’s equity ratio is now on par with the industry average.
From shareholders’ return perspective, large improvements in dividend and buyback policies were one of the drivers of general trading companies’ share price performance in 2023. Not only the introduction of the “progressive dividend” scheme but also aggressive share buybacks were particularly positive for Mitsubishi Corp, whose stock price was below BPS at the beginning of the year. When a company buys back its shares at a price to book ratio (PBR) less than 1, the BPS increases, resulting in a lower PBR than before the buyback. This made the stock look even more undervalued, attracting investors’ buy interest, and created a positive impact on the stock price, in our view.
Socionext
Socionext was the largest negative contributor in 2023. The company’s projection that the revenue and profit growth would plateau in the coming period was poorly received, causing the stock price to fall since we invested in July.
Socionext is a semiconductor design service company that went public in 2022. It was born from the merger of Panasonic Holdings’ and Fujitsu’s SoC (System on Chip) businesses in 2014, and it has been on our radar screen since its IPO. We began buying the stock in July 2023 when the share price plummeted due to concerns about short-term supply-demand deterioration following the announcement of a global offering by its major shareholders, the government-owned Development Bank of Japan, Panasonic, and Fujitsu.8
Excluding companies like Apple that have in-house chip design capabilities, Socionext is one of the largest players in the industry. Within the logic semiconductor market, they develop and provide custom SoCs for hardware makers who incorporate them into their final products.
The company’s revenue consists of two types: NRE revenue (Non-Recurring Engineering revenue) received from customers during the pre-mass production development stage, and product sales recorded after entering the mass production phase. The growth of NRE revenue is a function of the workforce (and productivity) of the company’s chip engineers. Usually, this part of the business aims to just break even or achieve a small profit at best. But once transitioned to product sales, there are almost no additional costs incurred with sales increases, resulting in high operating leverage, and that’s the juicy part.
Since around 2018, the company has implemented an organizational reform and globalization of its business, resulting in rapid changes in customer composition and the amount of “design wins”. The overseas ratio of NRE sales, which can be considered a leading indicator of future product sales, has expanded from about 30% five years ago to about 80% now. We can also confirm that the sales composition by node has risen to about 60% for the most advanced 5-7 nanometers (nm) chip designs in FY2023H1, from almost zero. We viewed this as positive.
In recent years, the pace of chip miniaturization is said to have been slowing as Moore’s Law is reaching its limit in the front-end field of the ecosystem. As such, the importance of semiconductor design as well as back-end process technologies such as advanced packaging is rising to continue improving chip performance known as PPA (Power, Performance, Area).
The strong growth of custom SoCs using advanced chips (7nm>) is particularly anticipated. Demand for semiconductors known as ASSPs (Application Specific Standard Products), which have specialized functions for applications such as mobile phones, has grown significantly over the last two decades. However, as consumer preferences diversify, hardware manufacturers wanting to release differentiated electronics products are increasingly choosing custom SoCs. Many of these hardware manufacturers are niche players who do not have the know-how to design semiconductors from scratch, creating business opportunities for Socionext.
The fact that the company’s design win amount has been growing at a fast clip is also encouraging. According to its results presentation, the annual design win amount has more than doubled from around 100 billion yen in FY2017 to around 250 billion yen ($675 million to $1.7 billion) in FY2022 thanks to an increase in the number of projects with value worth more than 30 billion yen ($202.8 million) each. With the complexity of semiconductors pushing up development costs, the sales plans for the final products in which these SoCs are used are also becoming larger. According to a survey by IBS, the average semiconductor development cost per node was $249 million for 7nm, $449 million for 5nm, $581 million for 3nm, and $725 million for 2nm, which is consistent with company’s business trend.9 This is positive for the company’s business, whose cost structure is fixed-cost oriented.
There are several listed close competitors such as Global Unichip, Alchip, and Faraday in Taiwan. Among similar companies, one of Socionext’s differentiating factors is its ability to cover the entire chip design process from upstream to downstream (architecture design, logic design/circuit design, physical design). Therefore, the company’s addressable market should be bigger than some of its competitors who can only provide services for the back-end design processes (mainly physical design, and some part of logic design). Japan’s geopolitically neutral position may also help Socionext win new businesses around the globe.
The company’s strength lies in its 2,000 strong veteran engineers, who advanced their careers when Japan’s semiconductor industry was number one in the world. In the rapidly advancing and complex field of cutting-edge semiconductors, if defects are found during the development process, the corrective work can be extremely cumbersome and costly. Socionext has a long track record of winning many deals from Japanese manufacturers for automotive semiconductors, which require the highest standards of safety and quality. Having a wealth of experience in this field is considered a competitive advantage going forward.
The last two fiscal years have seen an increase in design wins related to autonomous driving and in-car entertainment from U.S. and Chinese electric vehicle (EV) manufacturers. Particularly in China, modern Chinese consumers select new vehicles based on software features, making semiconductors (custom SoCs) an important product differentiation. Despite the Chinese economy being in the doldrums, local EV manufacturers are finding avenues for growth by exporting to Europe and ASEAN, and Socionext may benefit from this globalization trend.
In addition to the company’s robust design wins in automotive SoCs, demand is also strong for communications equipment, data centres, smart devices, industrial equipment, etc., all of which are growth areas. Furthermore, although Socionext has yet to announce any noticeable deal acquisition in much-hyped generative artificial intelligence (AI) chips, this new secular trend could be another tailwind for the company if generative AI is widely adopted in consumer devices for edge computing.
Although the near-term earnings may turn out to be lacklustre, we believe that the company will be in a phase of margin expansion and earnings acceleration over the medium to long term thanks to the above-mentioned organizational reform initiatives. For one, despite boasting more than twice as many engineers as its Taiwanese rivals, the company’s per capita sales and profits are still low. However, with the increase in design wins and the trend towards larger projects due to the globalization of deal acquisitions, as well as ongoing efforts to improve the productivity of engineers, the company could aim for an operating profit margin of around 15-20% and ROE of less than 30%.
Furthermore, as a research and development (R&D) intensive company (R&D expenses 49 billion yen/$330.6 million against sales of 193 billion yen/$1.3 billion in FY2022), Socionext is fully benefiting from Japan’s R&D tax incentives system. As a result, the actual corporate tax rate for FY2022 was a mere 15.7%. This is significantly lower than the statutory tax rate of 30.6%, which is a crucial point to consider when thinking about the intrinsic value of the company.
As for free cash flow, it was low in the previous period owing to the rapid increase in projects and the cost of procuring mask blanks etc, but the business is inherently cash-flow generative. Even assuming the management policy of a 40% dividend payout ratio of 40% and a 50% total payout ratio, we expect cash to pile up on its balance sheet over time.
The risk factors are: further in-house design of semiconductors by major tech companies (Apple, Microsoft, Google, etc.), intensified competition with the likes of U.S. Broadcom and Marvell Technology (both indirectly compete with Socionext coming from the ASSP space), and Taiwanese players (the above-mentioned companies plus Mediatek, etc.), as well as potential cancellations of projects acquired by the company. In addition, failing to make successful delivery of chip designs due to serious defects could damage the company’s reputation.
Click here for a full listing of Holdings.
- In this article:
- Japan
- Japan Fund
1 Adjusted EBITA is another management KPI where it is presented as adjusted operating income plus acquisition-related amortization and equity in earnings (losses) of affiliates.
2 Source: https://www.mag2.com/p/money/1384797, https://media.monex.co.jp/articles/-/22644.
3 Source: Results for the First Six Months of FY2023 Presentation Materials.
You might also like
-
 Portfolio Perspective
Japan Small Cap FundJapanese Small-Caps’ Earnings Resilience and Improving Returns on Capital
 Takenari Okumura, CMAPortfolio Manager
 Tadahiro Fujimura, CFA, CMAPortfolio ManagerRead the Commentary
In the following commentary, the Portfolio Managers cover small-cap outperformance drivers, pro-growth fiscal policy, governance reform, yen volatility, portfolio repositioning, profitability and capital efficiency trends, valuation gaps, and their 2026 outlook.
-
 Portfolio Perspective
Japan FundA Differentiated Portfolio Focused on Margin of Safety and Upside Potential
Masakazu Takeda, CFA, CMAPortfolio Manager Angus Lee, CFAPortfolio ManagerRead the Commentary
The Portfolio Managers summarize the significant events that drove markets over 2025 and how the Fund remains focused on quality, capital discipline, and valuation, with a clear preference for stock picking over index exposure.
-
 Investment Idea
Compelling Valuations in Japan
Masakazu Takeda, CFA, CMAPortfolio Manager
Angus Lee, CFAPortfolio Manager
Tadahiro Fujimura, CFA, CMAPortfolio Manager
Takenari Okumura, CMAPortfolio ManagerRead the Investment IdeaJapanese equities are currently trading at compelling valuation levels compared to other developed equity markets around the world and relative to their own historical averages. We believe the Japanese market deserves a closer look.