Market Commentary and Fund Performance
Masa Takeda of Tokyo-based SPARX Asset Management Co., Ltd., sub-advisor to the Hennessy Japan Fund, shares his insights on the Japanese market and Fund performance.
-
 Masakazu Takeda, CFA, CMAPortfolio Manager
Fund Performance Review
For the month of April, the Hennessy Japan Fund (HJPIX) declined 12.79% while the Russell Nomura Total Market™ Index lost 9.19% and the Tokyo Stock Price Index (TOPIX) decreased 9.58%.
Among the best performers were our investments in Terumo Corporation, Japan’s largest medical device manufacturer, Unicharm Corporation, Japan’s baby and feminine care products maker, and Kao Corporation, Japan’s largest manufacturer of home care and personal care goods.
Click here for full, standardized Fund performance.
As for the laggards, Mercari, Inc., the operator of Japan’s largest online flea market app “Mercari,” Sony Group Corporation, a diversified consumer and professional electronics, gaming, entertainment and financial services conglomerate, and Shimano Inc., global top market share bicycle parts manufacturer detracted from the Fund’s performance.
One of the biggest detractors this year is Mercari, the Japanese online consumer marketplace operator for secondhand items. The company’s beginner-friendly online flea market app has emerged quickly as the dominant go-to platform for Japanese consumers who want to dispose of used items for “de-cluttering” while earning some money as a seller. For buyers, it is a great online shopping destination where they can find bargains.
As we wrote in the August 2021 letter, the company is a rare find in the Japanese internet space in that they had a vision to become a global internet platform from day one. Thanks to its profitable and cash generative Japan business (20+ million monthly average users (MAUs), annual run-rate gross merchandise value (GMV) JPY 900bn ($7bn)), management has been pushing ahead with their global expansion at the expense of near-term profitability. This explains the company’s erratic quarterly earnings numbers, which have been hovering around the breakeven level since its 2018 initial public offering (IPO).
For asset-light internet companies to scale, acquisition of new users is often the biggest investment they need to make. Under GAAP accounting, such growth spending (i.e. cash incentives offered to new platform joiners, ad promotion costs, etc.) has to be recorded on the income statement in its entirety whereas a manufacturing business can capitalize its growth spending when building a new factory. This inevitably results in depressed reported earnings and inflated price to earnings (P/E) multiples. However, the important thing to remember is that these reported muted earnings are “intended” and not “forced.” Hence, one useful approach to value Mercari is to look exclusively at the profitable Mercari Japan business with the assumption that growth spending for new businesses be completely discontinued. This way, we would immediately see large profit on the income statement. Effectively, Mercari management is in a position to report profit at the flick of a switch if they choose to do so.
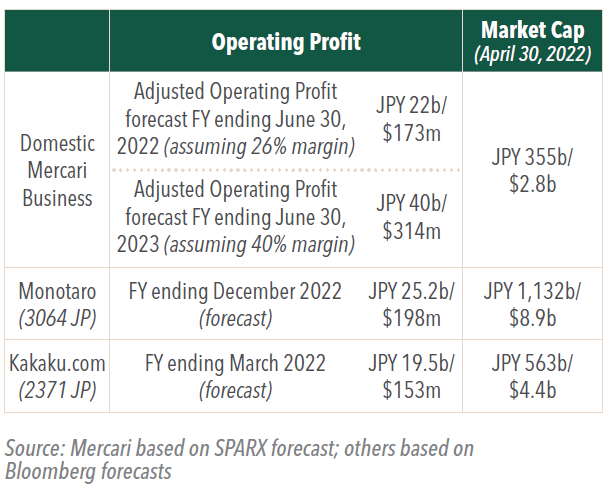
For fiscal year (FY) 2021 ending in June 2022, the gross merchandise value (GMV) is expected to be around JPY 900bn ($7bn), and at the current growth rate, it should reach JPY 1tn ($7.8bn) by the end of the next fiscal year. The standard take-rate is 10%, which means the Japan Mercari business on a stand-alone basis would generate JPY 100bn ($783mn) in revenue. Management has indicated that its mid-term target operating profit margin (OPM) can be around 40%. We consider this to be a realistic target given that the company has once exceeded 40% in a quarterly results and has been trending in the 30% range in most quarters. Furthermore, other profitable Japanese internet companies as well as established overseas peers have been achieving these kinds of profitability (e.g. Recruit Holdings’ wholly-owned subsidiary Indeed, M3’s Medical Platform segment, Meta, etc.). Thus, should management decide to maximize current year’s profit, an operating profit of JPY 40bn ($313mn) and net profit of JPY 28bn ($219mn) can be achieved. This implies that, based on the market cap at the time of our purchase of JPY 780bn ($6.1bn) almost two years ago, we entered at a P/E of 28x. Based on the most recent market cap of JPY 355bn ($2.8bn) at the end of April, P/E comes out to 13 times with a return on equity (ROE) of a whopping 70%. Mercari also appears undervalued from a relative valuation perspective. As you can see from the table below showing comparisons against some of representative Japanese pure-internet companies with similar profit sizes.
In terms of growth runway for the domestic business, the addressable market still remains abundant. According to the firm’s own survey, it is estimated that Japanese households in aggregate have JPY 44tn ($344bn) worth of secondhand items (up from 37tn ($289bn) in 2018) which could be sold through online flea markets rather than be disposed of. Clearly, there is a lot of room left for Mercari to penetrate. The study also found that the senior age group has the highest volumes of such items. Mercari has been tapping into this user segment (age 60+ users) aggressively with success in recent years. This is why we believe that retrenching growth investment in new initiatives outside of the mainstay Japan Mercari business should not tarnish its long-term growth prospects.
We have been disappointed by the sharp drop in Mercari’s shares since the start of the year, and it definitely hurts us. While the price fall was driven by the change in market sentiment away from growth to value stocks on the back of rising yields, the market also penalized the stock for slightly missing consensus GMV in the most recent quarter. Now that two full years have passed since the outbreak of COVID-19, GMV growth rate has been decelerating as the economy has reopened and people spend more time outdoors away from screens (somewhat expectedly). However, we believe that the use of online flea markets is still in the early innings and will eventually become a part of people’s lifestyle routine. The value proposition of using the app (bigger reach, better price transparency, unlimited store shelves, etc.) instead of holding a garage sale is quite compelling. Here, we are drawing on the experience of the early 2000s when the SARS outbreak catapulted the e-commerce businesses in Asia. Even after the outbreak subsided, the habit stuck around and accelerated. Lastly, the recent spike in inflation should also be a tailwind for secondhand-item markets over time. Particularly, rising living costs should steer consumers toward apps like Mercari which offers all-category marketplace services.
Internet growth stocks are hard to value with a definitive margin of safety. There is not much tangible book value, dividend yield, or low P/E multiples to quantitatively argue for limiting the downside risk. Yet, Internet businesses tend to come with high returns on capital, high operating leverage and large addressable markets all co-existing within the business, allowing for “exponential” growth if executed well unlike other types of “linear” businesses. For this reason, we believe it makes sense to have exposure in a diversified portfolio.
As of this writing, Hitachi, Keyence and Nidec have announced their FY2021 full year results with encouraging outlooks.
Hitachi
We initiated a position in this name about a year ago and subsequently made it one of the largest holdings in the Fund. At only 10 times forward earnings, Hitachi is a “growth stock in disguise,” with above-average growth prospects trading at value-stock like valuation multiples, in our view.
The company reported a solid set of FY2021 results with an all-time high net income of JPY 583bn ($4.6bn). ROE was 14.8%, substantially higher than average Japanese companies even though Hitachi has yet to complete its transition to a more profitable industrial data analytics-based hardware/software turnkey solution provider. The order backlog also climbed nicely across all segments, which bodes well for the new fiscal year and beyond. The Lumada business (please refer to our July 2021 commentary for more information), the crucial element in the future success of the company, continued to advance at a brisk pace now accounting for 16% of consolidated revenues, up from 10% in 2017.
Management also unveiled a 3-year business plan calling for an earnings per share (EPS) compound annual growth rate (CAGR) of 10-14% and an adjusted earnings before interest, taxes, and amortization (EBITA) (management KPI) target of JPY 1.2tn ($9.4bn) in FY2024. Furthermore, the plan also highlights cumulative free cashflow estimate of JPY 2.3tn ($18bn) (JPY 1.4tn ($10.9bn) from operating businesses and JPY 0.9tn ($7bn) from additional non-core asset sales). Of this, JPY 700bn ($5.5bn) will be used toward dividends and share buybacks. It should be noted that the amount of shareholder returns equates to over 10% of the current market cap.
Back in 2008, Hitachi had to resort to a large-scale equity raise to shore up its balance sheet in the midst of the financial crisis whilst incurring worst-ever net losses as a manufacturing company in history. In recent years, management has been expressing its intention to “pay it back” as a sign of its revival. Given that the current share price is only 10 times forward earnings, we welcome any share buyback program insofar its growth investments are not compromised.
If our investment view is correct, we expect both earnings growth and multiple expansion to drive up the share price going forward. Why do we believe there will be re-rating? Firstly, as the proportion of the software-driven business increases, it should bring about earnings growth that will be accompanied by margin improvement. Secondly, it also implies less earnings volatility as some of the Lumada use cases have recurring revenue component. Thirdly, Hitachi will likely consume less capital going forward than when it was a pure manufacturing concern, which means more free cash flow generation in the future. All of these trends should contribute to a lower equity risk-premium, resulting in a re-rating.
Keyence
Keyence announced strong financial performance in FY2021 (yet again) as its revenue and operating profit surged by 40% and 50% YoY, respectively. Net income topped JPY 300bn ($2.3bn) for the first time bringing its 14 year CAGR to 12+% since pre-2008 levels. The share price is currently about 30% below its record high marked last year. Hence, if the valuation multiple remains the same and the earnings continue to compound at its historical rate, then it would require roughly 2.5 years for the share price to regain its lost ground (earnings compounding at 12% for 2.5 years will see 30+% higher profits compared to today).
Since our first investment in 2008, Keyence has penetrated foreign markets but its overseas sales are still less than 60% of total. Management believes there is a long way ahead for further penetration. Considering that its per-customer sales overseas is still a fraction of the Japan business and other proven Japanese exporters average much higher overseas sales ratios overall, we find the company’s claim to be credible. We should also not forget that unlike most exporters that are struggling to grow topline domestically, Keyence is successfully growing its domestic sales thanks to its ability to identify demand in unmet factory automation needs through unrivaled consulting capabilities.
Nidec
Nidec reported a 19% revenue growth and 12% profit-before-taxes (PBT) growth for the FY2021. Though the company failed to meet the street consensus amid a raft of headwinds ranging from rising material costs, chip shortages to production halts in several Asian countries due to COVID-19 lockdowns, these numbers were all-time highs.
The investment thesis going forward for Nidec lies in its traction motor business for the electric vehicle industry. As the world’s largest direct current brushless motor manufacturer, there are many synergies management can leverage to become a dominant player in this burgeoning industry. Its strategy of aiming to be the lowest cost producer should be the right approach as electronic vehicles (EVs) are expected to become a commoditized product in the not-too-distant future. Why being commoditized so quickly? Because EVs will likely be viewed as a “connected device” from which tech companies can monetize through non-traditional ways such as over-the-air software updates (think Tesla) or in-car entertainment etc. As such, "drivability” of a vehicle (properties like acceleration, horsepower, torque etc. of the engine) to appeal to “car lovers” will no longer be areas of focus in product development. Instead, the hardware aspect of EVs will be simply evaluated on basic functions to serve transportation needs and cost competitiveness. We see that these dimensions are exactly how Nidec intends to stand out from the competition.
Another interesting trend is shaping up in the traditional automobile industry. Until recently, incumbent car makers were developing and manufacturing traction motors internally for their own EV models. However, as the auto industry faces more stringent emission standards having to cover related costs on the gasoline engine side, car companies are warming up to the idea that it is more economical and efficient to procure motors from third parties. Such outsourcing needs by traditional car makers should also drive Nidec’s revenue growth.
In the new fiscal year, management is projecting another 20+% growth in PBT. The company is on track to ship 3.6 million units of traction motors by FY2025 and 10 million units by 2030 (estimated unit price $1500 and OPM 15%). Nidec is rapidly ramping up global production capacity so that they can meet potential demand increases in the event the EV penetration accelerates faster than currently projected.
Click here for a full listing of Holdings.
- In this article:
- Japan
- Japan Fund
You might also like
-
 Portfolio Perspective
Japan Small Cap FundJapanese Small-Caps’ Earnings Resilience and Improving Returns on Capital
 Takenari Okumura, CMAPortfolio Manager
 Tadahiro Fujimura, CFA, CMAPortfolio ManagerRead the Commentary
In the following commentary, the Portfolio Managers cover small-cap outperformance drivers, pro-growth fiscal policy, governance reform, yen volatility, portfolio repositioning, profitability and capital efficiency trends, valuation gaps, and their 2026 outlook.
-
 Portfolio Perspective
Japan FundA Differentiated Portfolio Focused on Margin of Safety and Upside Potential
Masakazu Takeda, CFA, CMAPortfolio Manager Angus Lee, CFAPortfolio ManagerRead the Commentary
The Portfolio Managers summarize the significant events that drove markets over 2025 and how the Fund remains focused on quality, capital discipline, and valuation, with a clear preference for stock picking over index exposure.
-
 Investment Idea
Compelling Valuations in Japan
Masakazu Takeda, CFA, CMAPortfolio Manager
Angus Lee, CFAPortfolio Manager
Tadahiro Fujimura, CFA, CMAPortfolio Manager
Takenari Okumura, CMAPortfolio ManagerRead the Investment IdeaJapanese equities are currently trading at compelling valuation levels compared to other developed equity markets around the world and relative to their own historical averages. We believe the Japanese market deserves a closer look.