Portfolio Update: A Brief Retrospect, Portfolio Framework, and Investment Outlook for 2026
In this letter we share some thoughts from the Portfolio Managers at Broad Run Investment Management, LLC, the Fund’s sub-advisor.
-
 David Rainey, CFACo-Portfolio Manager
 -
 Brian Macauley, CFACo-Portfolio Manager
 -
 Ira Rothberg, CFACo-Portfolio Manager
February 2026
Performance data quoted represents past performance; past performance does not guarantee future results. The investment return and principal value of an investment will fluctuate so that an investor’s shares, when redeemed, may be worth more or less than their original cost. Current performance of the fund may be lower or higher than the performance quoted. Performance data current to the most recent month end, and standardized performance can be obtained by viewing the fact sheet or by clicking here. Neither forward earnings nor earnings growth is a measure of a fund’s future performance.
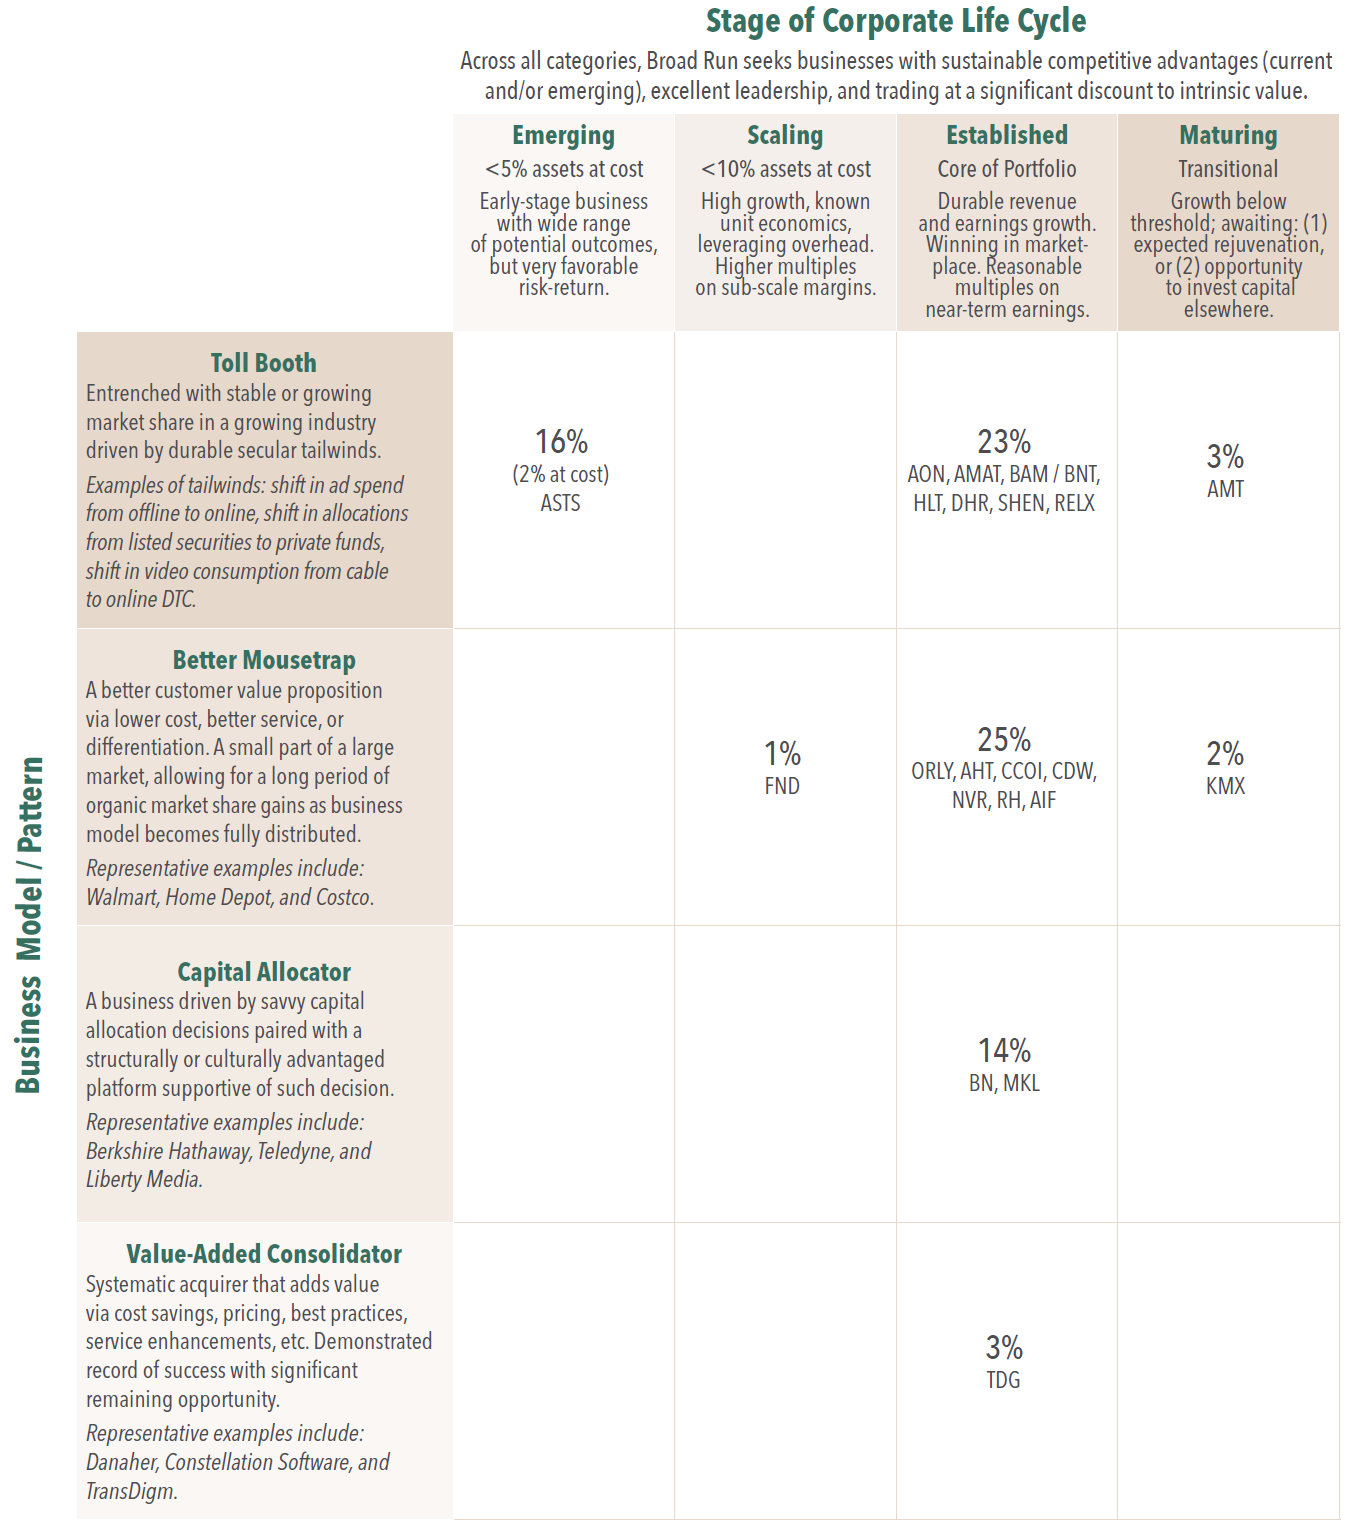
At year end, AST SpaceMobile had appreciated to become our largest position at 16% of assets (about 2% at cost). Since initiating the position in 2021, we have repeatedly referred to it as a “special situation”. We used this designation in recognition that AST is much earlier in its corporate life cycle than our typical investment, and therefore had greater risk, and potentially greater reward.
We have historically used the special situation label as a catchall for any investment that did not fit our core profile of an established, profitable, high-quality compounder. In addition to AST, special situations for us have included a handful of deep value, turnaround, and miscellaneous other investment profiles. However, with ongoing refinements to our investment approach, we have come to believe that there is a better way to explain our overall portfolio construction, and how earlier stage companies such as AST fit within it. We introduce this new framework in the appendix, after providing some commentary for context below.
A Brief Retrospective
For nearly 25 years our investment approach has focused on finding high-quality, well-run businesses with attractive long-term growth prospects. We employ rigorous fundamental analysis to identify these businesses, invest in them with a long-term mindset, and seek a margin of safety to both protect principal and enhance returns.
Overall, this approach has served us well. The mutual fund1 was recently recognized by Morningstar as one of the three best performing mutual funds of the last 25 years2.
We are pleased with these results, but we have also learned much along the way.
Understanding the Data
One of our key learnings is that stock returns are not normally distributed. There are fat tails at the right side and left side of the return distribution, with “right-tail” outcomes driving nearly all net results. According to research, just 3% of companies have created all the wealth in the public markets, while 59% of companies actually destroyed wealth (relative to risk-free Treasury bills)3. Investors generally understand that venture capital results follow an extreme payoff profile but are less aware that public market outcomes follow a similar pattern.
Our investment approach aligns well with this reality: pursuing compounders, while being mindful of risk. Achieving a right-tail outcome requires 15-25% compounded returns for more than a decade. O’Reilly Automotive, Brookfield, and American Tower have delivered these types of results for us. At the same time, we have fared better than average at avoiding the “left tail” – investments that are down 50% or more with little hope of recovery. We addressed this in our Q1 2022 Portfolio Update if you would like our full discussion on the topic.
Where Have We Gone Wrong
For every right-tail outcome we captured, we likely passed on five more. Names like IDEXX, Constellation Software, and Visa come to mind as significant misses. While our research correctly identified them as competitively advantaged and well run, with lots of room to grow, we failed to act because we over-weighted near-term valuation multiples. We focused too much on price of entry rather than intrinsic value. For exceptional businesses, paying up a bit for quality and growth tends to work out well over a long enough investment horizon.
At the same time, we occasionally invested in deep value and cheap but mature businesses that lacked right-tail potential. These were “static value plays” – stocks trading significantly below intrinsic value, but where that value was not growing much. While these investments could potentially double over several years, they offered limited opportunity beyond that. Effectively investing in this style requires regularly exiting ideas and recycling capital every few years, which does not fit our long-term mindset. And frankly, our track record here has been poor; despite superficially cheap entry points, these names accounted for a disproportionate share of our losses. While the negative impact was contained because they remained a small minority of assets (<15%), these investments had significant opportunity cost.
Learning Our Lessons and Sharpening our Focus
We believe in our core philosophy, but there is always room for improvement. Based upon our learnings, we have made a few tweaks to our buy box in recent years. These include:
- Exclusive Focus on Compounders. We have discontinued our pursuit of static value investments to focus exclusively on opportunities that have a chance for sustained mid-teens or better annualized returns over the next decade or longer.
- Access to a Wider Range of Compounders. We have opened the aperture to a wider range of compounders. This includes being willing to accept somewhat higher entry multiples for higher quality, higher growth businesses, as well as investing in some companies earlier in their life cycle. These are measured changes. For example, we expect less than 5% of assets at cost) to be in emerging businesses such as AST, and less than 10% (at cost) to be in high multiple, rapidly scaling businesses. As always, we expect the vast majority of capital will be deployed in established, profitable, high-quality compounders.
We believe these adjustments align our investment approach with our strengths, and will help focus our efforts. When we find investments meeting our criteria, history shows that we can own them for a decade-plus and enjoy 5x, 10x, and even sometimes 100x returns. Very few public equity investors ever realize a 100x return in an investment because it usually requires two to three decades of ownership and the fortitude to withstand multiple 40% drawdowns along the way. Yet, we have two such outcomes in our careers so far. We are probably 99th percentile in terms of patience and long-term orientation. We believe this is a strength, and are leaning into it.
With this evolution, we are sharing a new framework to help you understand our portfolio construction, and each holding’s place within it. In this framework, we categorize every holding by its (a) compounder business model and its (b) stage in the corporate life cycle. Please see the exhibit in the appendix for more detail.
Portfolio Earnings Update
As we do every fourth quarter, in this letter we provide an update on our portfolio earnings progress, including some more details on how we fared in 2025, where we stand over a longer-term basis, and our outlook for earnings and investment performance looking forward.
Please note that this earnings-based portfolio analysis is of diminished relevancy at this point in time because of our large position in AST, an unprofitable business. AST’s presence in the portfolio negatively impacts all key metrics, including 2025 portfolio EPS growth, long-term EPS growth, and our forecast of earnings growth in 2026. While AST is not contributing to portfolio earnings growth today, we believe it is creating significant value that will translate into accelerated portfolio earnings growth at some point in the future.
As we have discussed in the past, investment returns for equities can be broken down into three factors: growth in earnings, dividends, and change in valuation. In the short term, change in valuation can have a meaningful impact on investment results, but in the long term, change in valuation becomes much less important as growth in earnings and dividends accumulate to drive the majority of results.
For this reason, as long-term investors, our analytical focus is on trying to understand a business’s future earnings and dividends. We track how these metrics develop at each business we own, in aggregate across all the businesses we own, and at the portfolio level taking into account the impact of cash. This analysis helps us understand how these businesses are performing by providing a measure of progress independent of the vicissitudes of the stock market. At the end of each year, we report a summary of this information to give you additional perspective on your investment with us.
Please note, in this letter when we refer to “earnings” or “EPS” for our businesses, we mean earnings on a per-share basis, adjusted for certain items. We make these adjustments to arrive at what we believe to be a better measure of the true economic earnings of the businesses.
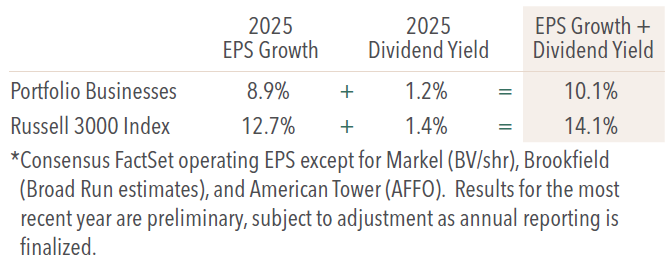
In aggregate, we estimate our portfolio EPS grew 8.9% and we received 1.2% in dividends, totaling to a 10.1% increase in earnings power value. The Russell 3000 Index is estimated to have led modestly, with 12.7% EPS growth and a 1.4% dividend yield, totaling to a 14.1% increase in earnings power value.
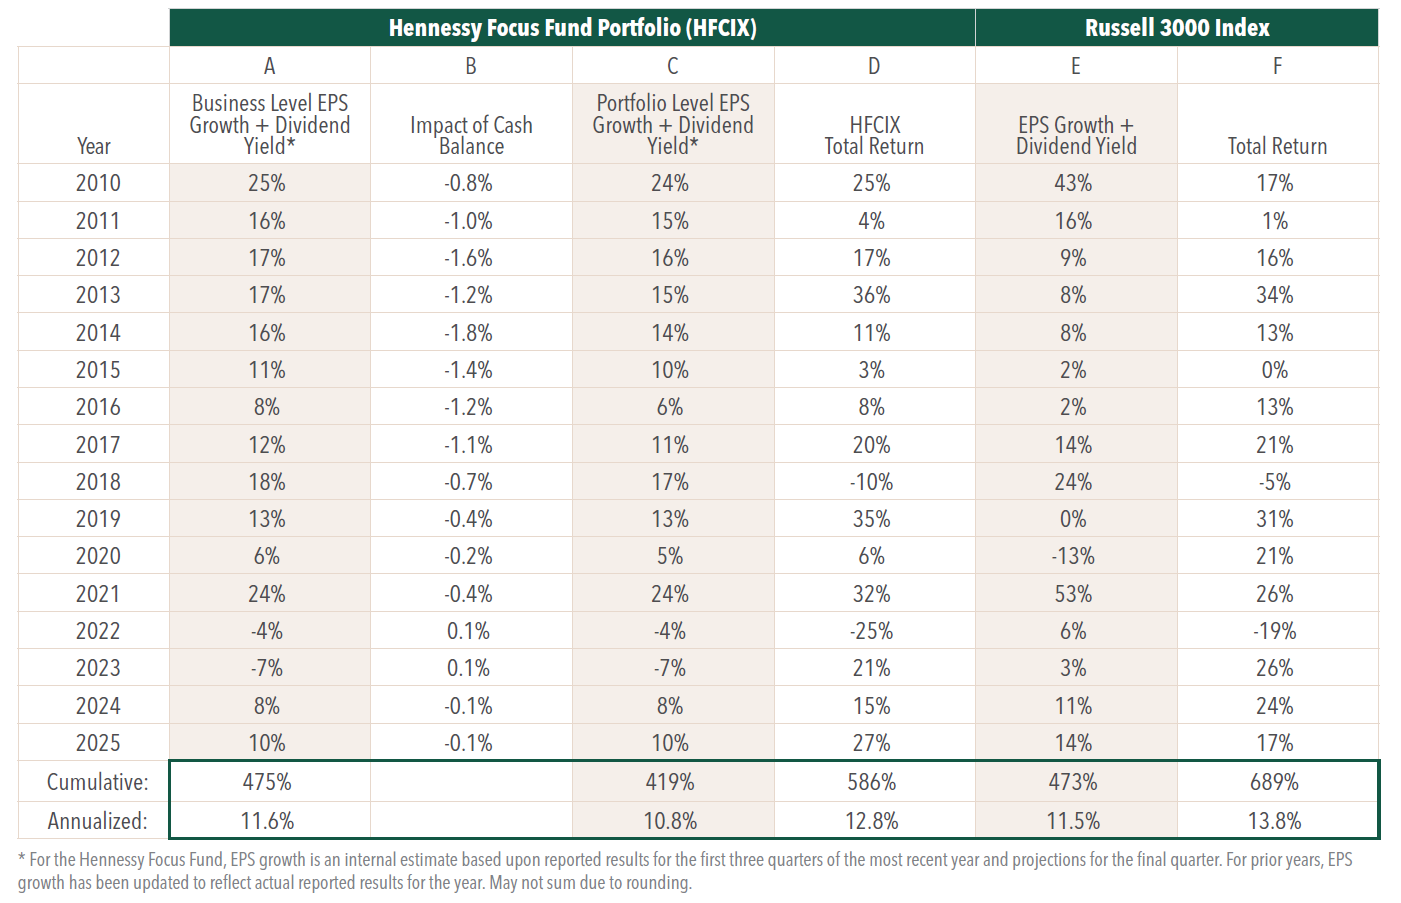
As a reminder, we underwrite our investments to target a mid-teens rate of return. We seek this return via the compounding of earnings over time rather than through a change in valuation or by cleverly trading in or out of a stock. As a result, our long-term portfolio performance is primarily driven by the earnings growth of the underlying businesses that we own4. You can see this relationship in the table below. Over the last sixteen years ended December 31, 2025, our portfolio level EPS CAGR is 10.8%, inclusive of dividends and cash drag [column C], compared to a realized total return of 12.8% net of fees [column D]. Please note that there is a loose relationship between earnings power and price performance in any given year, but that relationship strengthens considerably over longer periods of time.
Investment Outlook
Our objective is to own a portfolio of businesses that deliver a mid-teens rate of compounding over the long term, without incurring significant risk of permanent capital loss. This would give us a portfolio of right-tail outcomes. We remain steadfast in this pursuit, and believe that we are well-positioned to deliver over time.
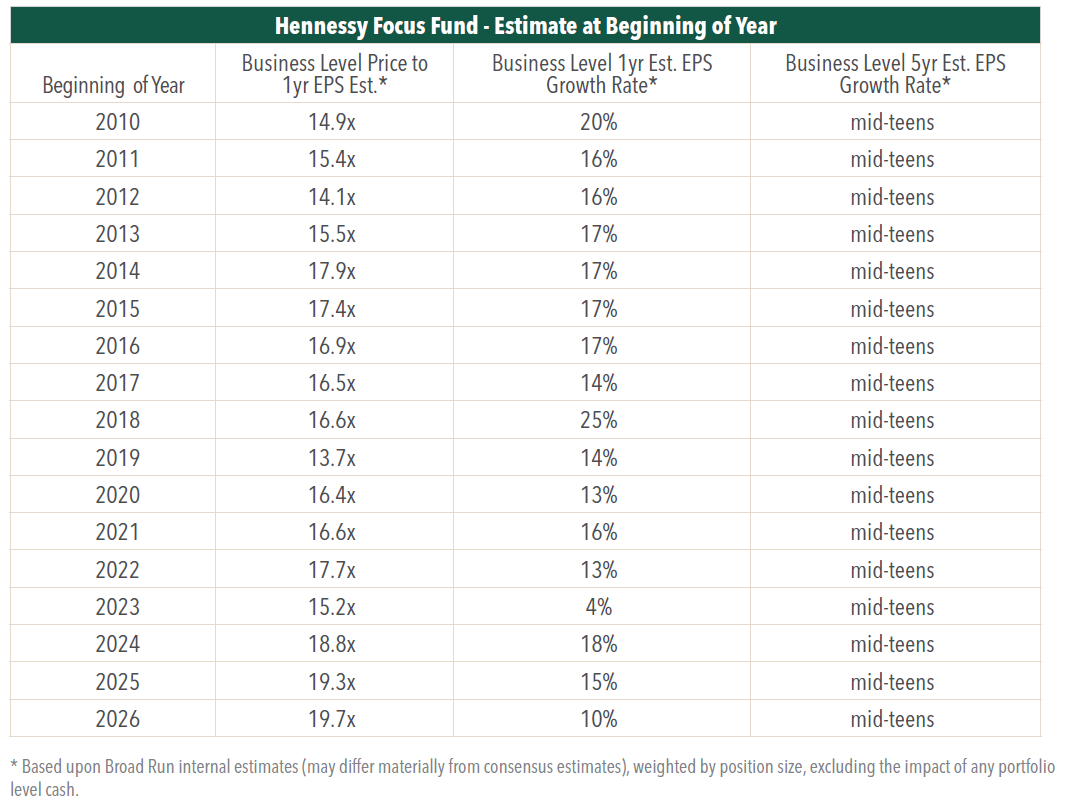
At year end, our portfolio is trading at 19.7x our 2026 earnings estimates, compared to 21.7x for the Russell 3000 Index. From this valuation level, we expect portfolio returns will roughly align with the rate of earnings growth produced by our portfolio over the next five years. We are forecasting a 10% rate of earnings growth for our portfolio in 2026, with a mid-teens rate over the five-year period.
Appendix: Portfolio Framework
Click here for a full listing of Holdings.
Click here for full, standardized Fund performance.
- In this article:
- Domestic Equity
- Focus Fund
1 We have served as portfolio managers for this fund since August 21, 2009, and as analyst(s) for the fund prior to that.
2 The 3 Best-Performing Funds of the Past 25 Years. Morningstar, January 27, 2026.
3 Wealth Creation in the U.S. Public Stock Markets 1926 to 2021, Hendrick Bessembinder, Arizona State University.
4 This is axiomatic: if there is no change in valuation and no dividends, stock performance will match the change in earnings per share. While EPS growth is not particularly useful to measuring progress at many types of investment strategies – for example, a high valuation-high growth strategy, a slow/no growth-deep value strategy, or a high turnover strategy – it is instructive for our strategy of long-term ownership of generally profitable business.
You might also like
-
 Fund Commentary
Cornerstone Growth FundA Fund Focused on Valuation, Growth and Momentum
 Ryan C. Kelley, CFAChief Investment Officer and Portfolio Manager
 L. Joshua Wein, CAIAPortfolio ManagerRead the Commentary
In the following commentary, the Portfolio Managers of the Hennessy Cornerstone Growth Fund discuss the Fund’s formula-based investment strategy and how it drives the Fund’s sector and industry positioning.
-
 Fund Commentary
Focus FundHigh Conviction on Companies’ Long-term Future Earnings Power
David Rainey, CFACo-Portfolio Manager
Ira Rothberg, CFACo-Portfolio Manager
Brian Macauley, CFACo-Portfolio ManagerRead the CommentaryThe Portfolio Managers review the second quarter market and the influence of elevated inflation, rate hikes, the development of AI, and what gives them confidence in the portfolio’s ability to continue compounding earnings.
-
 Company Spotlight
Focus FundAST SpaceMobile: Transforming How the World Connects
David Rainey, CFACo-Portfolio Manager
Brian Macauley, CFACo-Portfolio Manager
Ira Rothberg, CFACo-Portfolio ManagerRead the SpotlightAST is building the first and only space-based cellular broadband network accessible directly by everyday smartphones with both commercial and government applications. With strategic investments from leading technology players such as AT&T, Verizon, Vodafone and Google, AST has the bold goal to provide uninterrupted broadband connectivity, everywhere.