Portfolio Update: Results Recap and Investment Outlook
In this letter we share some thoughts from the Portfolio Managers at Broad Run Investment Management, LLC, the Fund’s sub-advisor.
-
 David Rainey, CFACo-Portfolio Manager
 -
 Brian Macauley, CFACo-Portfolio Manager
 -
 Ira Rothberg, CFACo-Portfolio Manager
Commentary
2022 was a difficult year, with the Fund down 24.71% net of fees. We outperformed the Russell MidCap Growth Index (down 26.72%), but underperformed the broader Russell 3000 Index (down 19.21%).
We avoided the bubble in speculative tech and aggressive growth stocks, but own a number of consumer discretionary, real estate, and financial sector businesses that were impacted by the slowing economy and rising interest rates. In addition, as has been the case for many years now, we did not have any exposure to the red-hot energy sector (+64% in 2022), or traditional economic “safe havens” such as consumer staples (-1% in 2022), health care (-3% in 2022), or utilities (+2% in 2022). As a reminder, we view energy companies as primarily driven by the price of underlying commodities that are inherently difficult to predict, and view utility businesses as too constrained by regulated rates of return. There are many consumer staples and health care businesses we would like to own, but have found them trading at high prices in relation to their growth prospects in recent years.
We regularly measure our portfolio’s overall cyclical exposure, and attempt to manage / mitigate this exposure with a ballast of acyclical and countercyclical businesses. Unfortunately, several of these ballast positions—most notably American Tower and Encore Capital—also had a difficult year in 2022.
Importantly, despite some of our stocks being down 30, 40, 50%-plus for the year, we do not have concerns about the viability or long-term cash generative capacity of these businesses. Some are suffering from a slowdown in demand and/or rising costs, but we believe that these headwinds will prove temporary due to their advantaged competitive positions and the enduring nature of the products and services they offer. In fact, some are likely to use industry distress to consolidate market share and end up in a better place than they otherwise would have been. This is most clearly illustrated by CarMax, but is likely to be true of other holdings as well.
Our objective is to own a portfolio of businesses that deliver a mid-teens rate of compounding over the long term, without incurring significant risk of permanent capital loss. We remain steadfast in this pursuit, and, despite 2022’s setback, believe that we are well positioned to deliver on our objective.
In the following table, we provide updates on some of our largest detractors from performance in 2022. We believe that many of these businesses have declined far in excess of what can be justified by their fundamentals, and therefore represent among the best opportunities in the market today. Indeed, some of these stocks have already rebounded sharply since the beginning of the year with only modest evidence that inflation and interest rates have crested.
| 2022 Perf. |
Port. Weight* |
Comments | |
| Carmax | -53% | 8% | In 2022, high used vehicle prices combined with rising interest rates to hurt affordability and drive industry-wide used car unit sales down an estimated 11% from 2021. This level of annual sales volume (Cox estimate of 36.2 million units) is in line with the worst rates seen over the last 35 years (36.9 million in ’92, 36.5 million in ’08, 35.5 million in ’09, 36.9 million in ’10 and ’11, and 35.8 million in ’13) and is about 10% below the average volume over the period. Demand weakened further toward the end of 2022 (down at a mid-teens rate) implying that 2023 volumes could be lower than 2022. Amidst this challenging industry backdrop, poorly prepared competitors such as Carvana, Vroom, and Shift, find themselves hemorrhaging cash and retrenching to survive while CarMax remains nicely profitable and continues investing in its key strategic initiatives. We believe CarMax is taking market share–as it has for nearly its entire corporate history–and will achieve record unit sales and profit when industry volume returns to normal. As a secondary market, used car prices adjust to find equilibrium between supply and demand, dampening cyclicality. Already, affordability has begun to improve with the Manheim used car price index down 13.7% in mid-January versus a year ago. Consensus calls for CarMax to earn about $3 per share in calendar 2023 (down from about $7 in 2021 and $3.50 in 2022), and we estimate normalized earning power of $6+ today (and growing over time). At a historical 17x multiple on $6 of earnings CarMax would trade at $102 per share, 52% above its latest price of $67. Longer term, with just 4% market share of late model used car sales, we see a pathway for CarMax to more than double its share as its emerging omni-channel capabilities further differentiate the company from competition. |
| RH | -50% | 5% | Sales of RH’s home furnishings are highly sensitive to luxury home turnover and equity markets. In 2022, the dramatic rise in mortgage rates and the decline in the stock market hurt housing affordability and consumer confidence. As a result, luxury home sales were down 38% YoY for the three months ended 11/30/22 according to Redfin (the largest decline on record). With one quarter remaining in its fiscal year, RH expects revenue for the fiscal year ending January 2023 to be down 3.5%-4.5%, im-plying that fiscal Q4 revenue will be down ~12%. This top line performance stands in stark contrast to the 32% revenue growth reported the prior year. There is no doubt that the pandemic and 2021’s robust level of housing turnover brought forward some home furnishings demand. We expect demand for the furniture industry to slow further in 2023, but expect several company specific growth initiatives (the rollout of RH Contemporary, opening of RH England, and introduction of a large number of new products across other collections) will allow RH to report just a 5%-10% revenue decline in the upcoming fiscal year. We expect that 2023 will mark the low for housing turnover (at a level not seen since 1980) and trough earnings for RH. At quarter end, RH had more than 35% of its market capitalization in cash on the balance sheet. The company under the stewardship of CEO Gary Friedman has a history of aggressive and well-timed share repurchases (having repurchased ~60% of its shares from FY16-FY18). We know from a recent regulatory disclosure that RH repurchased ~6% of its shares between 12/15/2022 and 1/3/2023. We expect the company to use the majority of its remaining cash balance to repurchase shares. Today, shares trade for 16x our base case estimate of NTM EPS. Over the long-term, we expect RH to compound EPS at a ~20% clip as it generates 10%+ sales growth (driven by pricing power, the continued rollout of its domestic large gallery strategy, and its nascent interna-tional rollout), a 25-30% operating margin, and uses its free cash flow to opportunistically repurchase shares and make strategic acquisitions. We continue to believe that RH has the opportunity to move from a roughly $3.5B revenue business to greater than $20B as it establishes itself as the only scaled global luxury furniture brand. |
| SS&C | -36% | 5% | In 2022, SS&C was impacted by slowing revenue growth, labor cost pressure, and rising interest expense. In its GlobeOp business, market volatility pushed hedge fund redemption requests to a multi-year high resulting in flattish AuA and revenue for the year. Other key business units, including Alts, Eze, Intralinks, and ALPS all saw revenue growth slow sequentially in Q3’22 and likely Q4’22, leading to company-wide revenue growth of an estimated 4% for the year versus an initial expectation of high single-digits. EBITDA margin for 2022 is expected to contract about three percentage points to 37.6% due to labor cost inflation and the mix effect of adding Blue Prism which had negative EBITDA margin at the time of acquisition. Additionally, rising interest rates pushed up the borrowing cost on the company’s revolver by several hundred basis points. Overall, EBITDA is on pace to decline 4% for the year and cash earnings per share about 7%. For 2023, we expect EBITDA and cash EPS to each grow about 7%. Management continues to work diligently to improve Blue Prism’s margins and believes its integration into internal SS&C processes will result in substantial labor savings. Acquisitions (a key ingredient in SS&C’s value creation formula) have remained hard to find, but rising debt cost and declining valuations have increased the chances of targets meeting the company’s underwriting standards. Against this backdrop, and the broader software industry sell off, SS&C has seen its valuation multiple contract from about 12.5x NTM EBITDA to about 9.5x. In response, the company will direct about half its free cash flow to share repurchases which are particularly attractive now with the stock at just 10.5x 2023 cash earnings. SS&C provides mission critical, utility-like software and services to its clients with high switching costs and low churn. We expect organic revenue growth to trough in 2023 then reaccelerate as new product introductions and pricing actions take hold. We also expect margin pressure to abate as wage inflation eases in the technology industry and Blue Prism begins to replace low value-add internal labor. Overall, we think SS&C is safe and cheap, with a high probability of 10%-plus compounding over the next five years, and a very good chance of mid-teens-plus compounding with the right acquisition(s). |
| Ashtead | -28% | 6% | Ashtead continued to produce stellar financial results in 2022, including revenue, EBITDA, and adjusted EPS up 28%, 26%, and 31% YoY in the most recently reported quarter. Despite the strong results, shares declined for the year as fears of a recession, and related decline in non-residential construction, increased. However, we believe these fears are based upon the market’s backward-looking understanding of Ashtead and miss some critical considerations. First, and perhaps most important, Ashtead has significantly diversified its business since the last recession. Today, because of its push into specialty rental categories (e.g., Power and HVAC, Climate Control & Air Quality, Flooring Solutions), less than 45% of end market exposure is to construction related markets compared to 55% heading into the GFC. Second, this non-residential construction cycle is likely to be very different from the last one because (a) government funded programs (the Infrastructure, CHIPS, and Inflation Reduction Acts) should add nearly $150 billion of demand per year, on average, over the next five years, on the existing non-residential construction market base of $900 billion, and (b) there are an abundance of megaprojects (projects > $400 million in value) in the planning and pre-bid phases (including data centers, airports, LNG plants, and EV battery plants). These megaprojects are highly likely to move forward despite the current macroeconomic environment and represent about 30% of construction starts value today, more than double what they were pre-GFC. Finally, we observe that interest rates have risen for more than a year now, yet, despite that, the Dodge Momentum Index, which measures future projects in planning, is at its highest level ever. We believe these considerations, combined with Ashtead’s continued steady market share gains, will power the business through a recession. We continue to expect Ashtead to compound its earnings per share at a mid-teens or higher rate per annum over the next decade as its market share increases from about 12% today to more than 20%. Trading at about 15x our estimate of NTM EPS, we believe that shares offer a compelling value. |
| Am Wood | -25% | 4% | American Woodmark’s business had a good year, with 2022 sales up an estimated 10% and EPS up 35%. Much of this improvement was driven by successful price increases passed along to home center, builder, and dealer-distributor customers. EBITDA margins increased to about 10% from 9% in the prior year. Longer term we expect EBITDA margins to return to the low- to mid-teens, where they were for many years prior to the recent inflationary surge. However, industry demand is waning as new home construction (about 45% of end market demand) slows due to affordability issues. Remodeling activity (about 55% of end market demand) has slowed as well but we expect it to be more resilient than new home sales due to an aging housing stock, record high home equity, and consumers “locked-in” to their existing home due to ultra-low mortgage rates at their time of purchase. New home building permits are down 28% versus a year ago, and single-family building permits are pacing about 730,000 units per year now, well below the 1.1 to 1.2 million units needed to support population growth. American Wood-mark earned an estimated $6 per share in 2022, and is expected to earn $6-plus in 2023 despite the demand slowdown (it also earned $6+ in 2018, 2019, and 2020). With the stock at $53, this is less than 9x 2023 EPS, equating to an 11% earnings yield on what should be near trough earnings. Normalizing housing starts and EBITDA margins would drive EPS to around $9, and we think company specific improvement initiatives should be additive from there. This business is cash generative and should repurchase significant shares outstanding over the next several years at what we believe to be bargain prices. |
| Encore | -23% | 9% | After a stellar 2021 (appreciating 59%), Encore gave up some of its prior year gain in 2022. In order to understand the forward opportunity for this countercyclical business, it is helpful to summarize the events of the last few years. In 2020/2021, the personal savings rate spiked as historic levels of government transfers boosted household income while consumer spending was severely curtailed by social distancing. As a result, Encore’s cash collections benefited as many consumers used a portion of their excess savings to pay off debts. This dynamic had both positive and negative effects on Encore. In 2021, Encore’s cash generation reached exceptional levels allowing the company to repurchase 23% of its shares outstanding while reducing its leverage ratio to the low end of its target range. At the same time, the credit card charge-off rate fell to half its long-term average level, reducing the supply of paper available to purchase. Heading into 2022, we thought the company was well positioned to take advantage of an eventual normalization of the charge-off rate on credit cards loans. To our surprise, the build in delinquencies and eventual charge-offs has taken longer to develop because of accumulated consumer savings and low unemployment. The data is clear that Americans are now growing more reliant on credit cards amid inflation and depleted savings. We expect the charge-off rate to rise from 1.9% today to 3%-4% by year end 2023. With a limited number of buyers of freshly charged-off credit card paper and an influx of supply, prices of portfolios should decline over the coming years resulting in higher returns and earnings for Encore. Encore has one of the strongest balance sheets in its industry, low borrowing costs, and one of the most efficient collections platforms, so we think it is poised to deploy capital at excellent returns for the next several years. Shares trade at a very modest 7.5x our estimate of NTM owner EPS, despite earnings being suppressed at what we think is the bottom of the charge-off cycle. |
| NVR | -22% | 6% | After years of home price appreciation, a near doubling of mortgage rates in 2022 severely impacted housing affordability and buyer confidence. As a result, the pace of single-family new home sales has fallen 28% versus a year ago to 730,000 annualized units, well below the estimated 1.1 to 1.2 million units needed to accommodate population growth. We like the setup from here as homebuilders are an early cycle industry and we expect mortgage rates to ease as inflation subsides and spreads normalize. We have already seen some progress toward this with the latest 30-year mortgage rate at 6.15% compared to about 7.08% at the peak in November of 2022. Over a full housing cycle, we expect NVR to expand revenue about 7-12% per annum, composed of 5-10% organic unit growth and about 2% pricing growth. With a 35%-plus ROE, NVR should have significant free cash flow to direct toward share repurchases, pushing total earnings-per-share growth to about 13-16% per annum. We think housing production will begin to return to a normalized level in 2023, and that pricing in NVR’s all-important Washington, D.C. metro market will not be down as much as feared. Shares trade for 10x TTM EPS and about 15x 2023 EPS (on what we think should be trough earnings), a premium multiple to other homebuilders, but more than fully justified, in our view, given the much better economics of its flexible and asset-light business model. |
| *Portfolio weight as of 12/31/21 |
Portfolio Changes
During the fourth quarter, we established new positions in Cogent Communications, Danaher, Hilton, TransDigm, and Warner Music Group, each at slightly less than 1% of assets. We generated funds for the new positions by trimming our large positions in American Tower, Brookfield Asset Management, Aon, and Markel. We also added modestly to our AST Space Mobile position and sold most of our Allegiant Travel position to recognize tax losses. We profile our new investment in Cogent below.
New Position: Cogent Communications
Cogent Communications is a provider of fiber-based internet services to businesses. It provides two primary flavors of such service today: “direct internet access,” and “transit.”
Direct internet access connects businesses in large multi-tenant high-rise office buildings to the internet with enhanced speed, reliability, and security. Cogent, with its fiber-based network, typically competes in a building with one other fiber-based provider and the incumbent telco (AT&T, Verizon, etc.) that relies on copper-based technology. Cogent, unlike the competition, prewired these buildings enabling much faster install times (days instead of weeks or months) and lower marginal install cost. In addition, compared to the copper-based telco, Cogent’s fiber can offer far faster data speeds (30-60x faster). This is a very steady business since customers have long-term office leases and rarely change their internet service provider. In this market, Cogent competes by charging a similar price as the competition but offering a far superior service. Cogent has about 15% customer penetration in its buildings, with a long history of steady share gains as tenants become aware of its value proposition.
The internet is a network of smaller networks, and if the smaller networks want to exchange data with one another they need to physically connect in some manner. Transit is a service providing that physical connection for the 5,000 or so smaller networks as well as the 4,000 or so largest content companies that need to deliver their content around the world. Cogent has established one of the most complete and efficient transit networks through opportunistic fiber acquisition and lease arrangements (IRUs). A low-cost position allows Cogent to go to market with a comparable service to others but with much lower pricing. This strategy has enabled Cogent to grow from 0% market share 15 years ago to about 15% revenue market share today (and about 24% volume share), with prospects for further gains ahead.
These are two good businesses that combine to make a great financial profile. From 2005 through 2019 Cogent’s revenue compounded at 11% without a single down year, and EBITDA margins expanded from 8% to 34%. The pandemic has been a net negative for Cogent, with the direct internet access business hurt by an increase in office vacancy rates, partially offset by huge volume increases in transit with Zoom and DTC streaming video adoption. Overall, revenue growth decelerated to the low single digits the last three years with modest margin expansion. Over the next several years we expect a gradual recovery in direct internet access growth and deceleration in transit growth leading to combined company growth rising to the high single digits (below the long-term historical 11% rate).
We find these two existing businesses attractive, but they are not core to our thesis on Cogent. To understand the opportunity driving our interest, it is important to take a step back to understand Cogent’s origin story. Dave Schaeffer, founder and CEO, built the company through opportunistic acquisition in the aftermath of the telecom bubble in the early 2000’s. Dave made numerous acquisitions of distressed businesses and assets at that time. In total, he acquired about $14 billion of assets (at original cost) for only $60 million. In other words, Dave bought these assets for less than a penny on the dollar. However, since 2004, Cogent has not completed a single additional acquisition despite reviewing many prospects.
In September 2022, that story changed. Cogent announced it would be making its first acquisition in 18 years, acquiring Sprint’s enormous wireline network for the princely sum of $1.00. Further, T-Mobile (parent company of Sprint) will pay Cogent$700 million over the next four years for taking this old Sprint asset off its hands. Why would T-Mobile pay Cogent nearly $700 million to take this asset? Because revenue has been in decline for twenty years and the asset is losing $280 million of EBITDA per year. This asset is strategically non-core, and T-Mobile is ill equipped to fix it on its own. Regulatory oversight and overlapping corporate customers make it impractical to shut the business down.
So, why does Cogent want this asset? In short, one man’s trash is another man’s treasure. On its own, the Sprint network is not valuable (indeed, it has negative value), but when combined with Cogent’s existing network and other capabilities, it has the potential to create extraordinary value. This value creation will come from both cost and revenue synergies.
At the time the deal was announced, Sprint’s wireline network sold 28 services, of which 24 were gross margin negative. Eliminating these 24 services will reduce revenue by $120 million, but also reduce EBITDA losses by $100 million. The remaining Sprint business will generate revenue of about $440 million with EBITDA losses of $180 million. This Sprint wireline network is predominantly long-distance fiber, requiring Sprint to lease 93% of its local fiber connections from third parties to provide service. Cogent’s network has extensive local fiber with excess capacity. Migrating Sprint traffic off of third-party routes and onto Cogent’s network will save $180 million in lease expense and bring the Sprint asset to near EBITDA breakeven. Further network rationalization and head count eliminations should save an additional $40-$50 million allowing Cogent to bring the Sprint network to about $45 million of positive EBITDA in three or four years.
However, the largest value creation lever comes from Cogent’s ability to enter the North American wavelength services market. Wavelengths are a form of high capacity, point-to-point data transfer used by large corporations (Google, Amazon, Microsoft, Charter, Comcast, etc.) to move massive amounts of data between their data centers. On its own Sprint could not compete in this market because of its lack of local fiber and data center connections (Sprint is in only eight carrier neutral data centers). Cogent solves this problem by bringing a dense local fiber footprint and connections to over 800 carrier neutral data centers. Cogent on its own could not compete in the wavelength market due to its lack of long-distance fiber capacity. Sprint solves this by providing Cogent with 19,000 miles of long-distance fiber networks along unique pathways. Separately, neither company possessed the assets to compete in the wavelength market, but together they have the capabilities to be a substantial player.
Leaders in the wavelength market today include Lumen and Zayo, followed by dozens of competitors each with low market share. Similar to its transit business, to win market share Cogent will probably offer a comparable service to the market at a substantially reduced price. Additionally, Sprint’s network was originally built along rail lines so it has many unique routes with no overlapping wavelength provider. These unique routes will be appealing to network engineers who seek redundancy in the event that one network pathway is cut—which happens surprisingly often.
Cogent is targeting 25% wavelength market share within about seven years of closing the Sprint deal. This would equate to about $500 million of incremental revenue. The marginal cost to provide this service is low, so the company expects incremental EBITDA margins exceeding 90%. This incremental $450 million-plus EBITDA from wavelength is an enormous opportunity compared to Cogent’s $230 million base of EBITDA today.
Cogent is still led by its founder, Dave Shaeffer, who owns about 10% of the business. Big picture, we view an investment in Cogent as a way to partner with Dave, one of the most accomplished capital allocators we know of, as he embarks on perhaps his biggest acquisition ever. That is measured by network size and assets, and not the acquisition purchase price of $1.00! However, we have also conducted many channel checks with competitors, consultants, and former employees to validate the asset quality, cost synergy, and wavelength opportunity ourselves.
We think Cogent’s established businesses of transit and direct internet access can earn about $480 million of EBITDA in 2030 compared to $230 million in 2022. Cost synergies from the Sprint wireline transaction should add an additional $45 million of run rate EBITDA by 2030. Lastly, we assume in our model that Cogent realizes about half of its revenue goal in the wavelength market, achieving 12% market share which translates into about $220 million of incremental EBITDA. Combining these three items, we believe Cogent can compound EBITDA at 16% from $230 million today to $750 million by 2030. With the addition of Cogent’s roughly 6% dividend yield we believe we can earn a 20% annualized return, or better, from our purchase price.
Portfolio Earnings Update
As we have discussed before, investment returns for equities can be broken down into three factors: growth in earnings, dividends, and change in valuation. In the short term, change in valuation can have a meaningful impact on investment results, but in the long term, change in valuation becomes much less important as growth in earnings and dividends accumulate to drive the majority of results.
For this reason, as long-term investors, our analytical focus is on trying to understand a business’s future earnings and dividends. We track how these metrics develop at each business we own, in aggregate across all the businesses we own, and at the portfolio level taking into account the impact of cash. This analysis helps us understand how these businesses are performing by providing a measure of progress independent of the vicissitudes of the stock market. At the end of each year, we report a summary of this information to give you additional perspective on your investment with us.
Please note, in this letter when we refer to “earnings” or “EPS” for our businesses, we mean earnings on a per-share basis, adjusted for certain items. We make these adjustments to arrive at what we believe to be a better measure of the true economic earnings of the businesses.
2022 Business Results
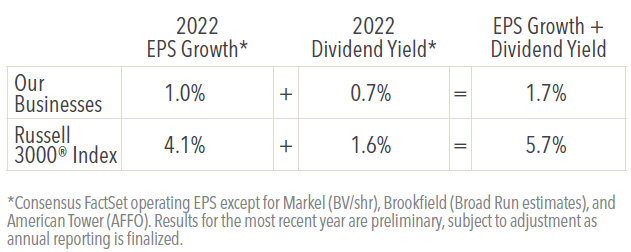
In 2022 our businesses faced headwinds posed by inflation, rising interest rates, and declining affordability. In aggregate, we estimate they grew EPS 1.0% and paid a 0.7% dividend. The broader market is estimated to have done modestly better with 4.1% EPS growth and a 1.6% dividend for the Russell 3000 Index.
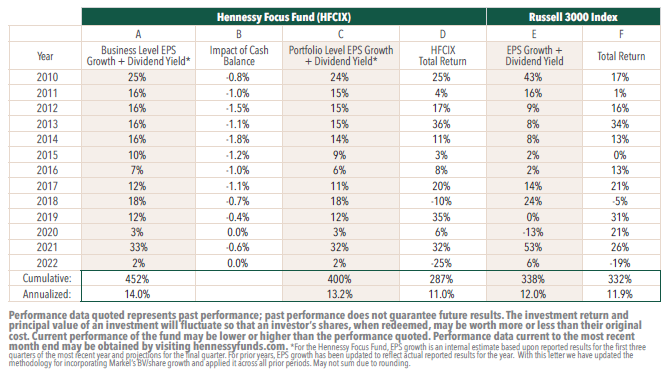
As a reminder, we underwrite our investments to target a mid-teens rate of return. We seek this return via the compounding of earnings per share over time rather than a change in valuation or clever trading in or out of a stock. As a result, our long-term portfolio performance is primarily driven by the earnings per share growth of the underlying businesses that we own.1 You can see this relationship in the table below. Over the last thirteen years, our portfolio level earnings per share CAGR is 13.2%, inclusive of dividends and cash drag [column C], compared to a realized total return of 11.0%, net of fees [column D]. Please note that there is a loose relationship between earnings power and price performance in any given year, but that relationship strengthens considerably over longer periods of time.
Investment Outlook
As we stated earlier, some of our businesses are suffering from a slowdown in demand and/or rising costs. We believe that most of these headwinds will prove temporary due to the advantaged competitive positions of the businesses we own and the enduring nature of the products and services they offer. 2022 was a year of below target earnings growth for our portfolio, and 2023 is shaping up to be subdued as well. We forecast a 4% rate of earnings growth in 2023 (5% inclusive of dividends) for our portfolio, which is roughly in line with consensus forecasts for the broader market. We expect 2023 to be a year of adjustment, and potentially recession, for the economy as consumers and businesses acclimate to higher inflation and interest rates. We believe that the fundamentals for our businesses will strengthen and move back toward our mid-teens expected compounding in the intermediate term after this period of economic adjustment.
At year end, our portfolio valuation of 15.2x our 2023 earnings estimates (compared to 16.8x for the Russell 3000), is at or below where it has been over most of the last 13 years reflecting the macroeconomic uncertainty and expectations for subdued near-term growth. From this valuation level we expect portfolio returns will meet or exceed the rate of earnings growth produced by the portfolio over the next five years.
Click here for a full listing of Holdings.
Click here for full, standardized Fund performance.
- In this article:
- Domestic Equity
- Focus Fund
You might also like
-
 Portfolio Perspective
Focus FundSeeking Companies with Strong Growth at Attractive Valuations
David Rainey, CFACo-Portfolio Manager
Ira Rothberg, CFACo-Portfolio Manager
Brian Macauley, CFACo-Portfolio ManagerRead the CommentaryThe Portfolio Managers rely on their strategy of owning durable, well-run businesses capable of turning adversity into opportunity and adapting to macroeconomic surprises. The following Hennessy Focus Fund Commentary recaps the 2025 market and highlights areas of opportunity ahead.
-
 Portfolio Perspective
Focus FundFrom Rate Cuts to AI: Positioning the Portfolio for Potential Opportunity
David Rainey, CFACo-Portfolio Manager
Ira Rothberg, CFACo-Portfolio Manager
Brian Macauley, CFACo-Portfolio ManagerRead the CommentaryThe Portfolio Managers discuss holdings that could potentially benefit from lower rates, tariffs, and artificial intelligence (AI). The team also provides an update on AST SpaceMobile and discusses potential opportunities in select Technology and Health Care companies.
-
 Company Spotlight
Focus FundO’Reilly Automotive—Revved for Growth
David Rainey, CFACo-Portfolio Manager
Ira Rothberg, CFACo-Portfolio Manager
Brian Macauley, CFACo-Portfolio ManagerRead the SpotlightO’Reilly Automotive is a leader in the automotive aftermarket parts industry in the U.S. The company’s scale, unique distribution infrastructure, and customer service-oriented culture should allow it to take market share in a fragmented U.S. market for years to come.