New Holding “Shentel” Might be Almost Heaven
In this letter we discuss the investment environment and some recent tweaks to the portfolio.
-
 David Rainey, CFACo-Portfolio Manager
 -
 Brian Macauley, CFACo-Portfolio Manager
 -
 Ira Rothberg, CFACo-Portfolio Manager
Commentary
The second quarter of 2022 was very much a continuation of the first. Concern about high inflation, rising interest rates, and growing economic uncertainty contributed to another big down quarter. The Russell 3000 Index declined 16.7% during the period, and is down 21.1% for the half year. This is the worst market decline for a first half in 52 years.
In general, the companies we own continue to experience solid business trends, with good demand and growing revenue and profits. The few exceptions to this are our holdings in housing and big-ticket consumer-oriented businesses where higher interest rates and stretched affordability are having some impact. Our estimates for the portfolio have come down slightly for 2022 and 2023, but we are still projecting solid double-digit earnings growth each year (similar to FactSet consensus forecasts).
Against this modest earnings adjustment (<5%) we have seen a significant (22%) decline in portfolio price. Our portfolio is now trading at 13.6x our next twelve-month earnings estimates, the lowest multiple we have seen since 2011. Looking below the portfolio’s surface, our businesses with the most cyclical exposure have had their stocks hit the hardest. We own a number of cyclical growth companies now trading at 8-13x earnings estimates (i.e. Ashtead Group, RH, Applied Materials, Allegiant Travel), compared to their historical 15-22x range.
With this divergence between fundamentals and prices, the market appears to be discounting a high probability of a recession (and corresponding negative earnings revisions), which is clearly a possibility, but far from certain. There are many reasons to be concerned about the economy, but there are also reasons for optimism. Notably, the average consumer balance sheet is in very good shape with a record level of home equity and cash, and the job market is strong with many more job openings than there are job seekers, and 2.7 million jobs created year-to-date.
Recession or not, we do not think it will matter much to our portfolio in the fullness of time. Near term earnings results are but a small part of the long-term stream of future cash flows that dictate what a company should be worth. And, as we have seen in past recessions, the types of companies that we typically own—industry leaders with strong balance sheets and excellent management teams—can sometimes use a recession to create a step function increase in long term value by taking advantage of consolidation and expansion opportunities that would not otherwise exist.
Of course, the economy and spending patterns have been highly unusual since the emergence of Covid-19 with demand fluctuating wildly across time and industry. It begs the question, how reliable are today’s earnings as an indicator of value? Are recent earnings reflective of enduring earnings power, or are our companies over-earning a normal rate?
As a whole, we do not think our business are overearning. We own long-established companies with observable revenue and profit patterns across a decade or more. We can rewind the clock to 2019 (before Covid distortions emerged) and estimate what profitability would have been today had the pandemic never happened. Current estimates do not depart significantly from our “Covid normalized” analysis, giving us confidence in the underlying earnings power of these businesses and their eventual stock price recovery.
In contrast, as we highlighted in our letters a year ago, enthusiasm for growth technology/unproven concept companies resulted in excessive valuations based upon flim-flam metrics such as EV/sales, and EV/TAM. Much of that bubble has now burst, and we think most of those stocks are unlikely to ever recover to prior highs.
During turbulent times, we gain confidence from owning a portfolio of high-quality, well run, cash generative businesses at reasonable valuations that we believe are going to grow their earnings significantly over the next five and ten years. At the beginning of 2022, you had to pay roughly 18x earnings for our portfolio of businesses, now you pay roughly 14x. With no meaningful change in the outlook for long-term earnings power, we like the investment setup from here.
During the quarter we added a new 1% position in Shenandoah Telecom (discussed below) and added to our existing position in Applied Materials. We trimmed our positions in NVR, American Tower, Markel, and Encore Capital Group to help fund these purchases.
Almost Heaven: Shenandoah Telecoms
In his 1971 Platinum hit Country Roads, John Denver sings: “Almost Heaven, West Virginia, Blue Ridge Mountains, Shenandoah River. Life is old there, older than the trees…” While this ballad honors the unique beauty of West Virginia and the broader Appalachia region, John Denver could just as well have been singing about our latest investment: Shenandoah Telecom.
Shenandoah Telecom, a/k/a “Shentel,” began as a rural cooperative telephone system in western Virginia in the early 1900s. It grew through the years organically and via acquisition, and now is a leading provider of telecommunications services to rural geographies in Virginia, West Virginia, Maryland, and Kentucky. As we will explain later, it is this unique geographic footprint, with low population density, mountains, valleys, and forests that give Shentel a desirable position in the broadband communications industry.
Today, Shentel has two core assets: (1) an established cable broadband business with 210K passings (110K subscribers/52% penetration), and (2) an emerging fiber broadband business with 93K recently constructed passings, and another 357K passings to be constructed in the next several years (targeting 40% eventual subscriber penetration). It also has a third non-core asset, a cellular tower network (210 towers in Virginia) that will likely be sold in the coming years.
Cable Network
Historically, cable broadband networks have been very high-quality assets. Their core service offering, high speed internet connectivity, is utility-like with recurring revenue, growing demand, and low cyclicality. The high fixed costs to build and maintain a network means most markets can only economically support one or two providers leading to natural monopolies and duopolies. And, low variable costs enable high incremental profit margins on incremental revenue.
However, recently cable networks have been facing increased competition from two primary sources: fiber overbuilders and fixed wireless (FW). Most cable networks appear poised to lose market share in the coming years as these new entrants gradually chip away subscribers. However, we believe Shentel, by virtue of its unique geography/topography, is much more insulated from these threats. We explore this further below.
Fiber overbuilders. Fiber overbuilders are spending tens of billions of dollars building new fiber optic broadband networks in direct competition with incumbent cable networks. It is estimated that 60-70% of the country will have access to a fiber broadband connection in a decade, compared to about 35% now. Fiber offers speed and reliability advantages versus cable connectivity allowing new fiber networks to carve out meaningful market share where they compete.
Key to the economic equation for fiber overbuilders is having enough population density in a target market to keep the network construction cost per passing low. The large fiber overbuilders—AT&T, Lumen, Frontier—speak of needing a cost per passing of around $1,000 to earn an acceptable return on investment. In Shentel’s cable markets, because population density is low and homes are spaced far apart, it would cost an estimated $2,000 per passing, on average, to overbuild with fiber. In addition, Shentel’s markets tend to have lower than average household income and have correspondingly lower broadband adoption. This reduces the number of likely subscribers per passing, making the economic equation even more prohibitive for any potential new entrant.
Fixed wireless. Fixed wireless is broadband internet delivered over a wireless carrier’s spectrum from a cell tower to someone’s home. Fixed wireless has two limitations—capacity and propagation.
Wireless spectrum has only so much capacity to handle traffic. Put too much traffic on the spectrum too quickly and speeds all subscribers experience degrade materially. As a result FW subscribers have to be added in a very judicious manner. To put numbers on it, T-Mobile, with the most aggressive FW agenda in the U.S., expects to “pass” 60mm homes with fixed wireless by 2025 with 7-8mm FW subscribers. This works out to a 12.5% penetration rate in their markets and a 5% penetration rate nationally. Even if successful, FW has a limited ability to cut into incumbents’ market share.
Additionally, spectrum can only propagate so far depending on its frequency. The higher the frequency, the less far the spectrum can travel and the more likely it will be absorbed by trees, leaves, hills, etc. Low band spectrum in the 600MHz range can travel very far and go through pretty much anything in a normal environment. But the primary spectrum being targeted for use by FW is mid-band, 2.5GHz or higher, which we believe will have a much more difficult time propagating through the leaves, trees, and hilly terrain of the Shentel markets.
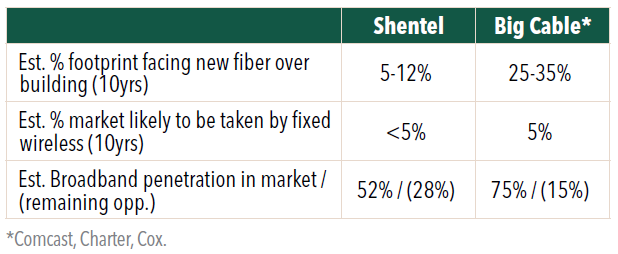
Overall, we think Shentel will face minor incremental encroachment (mid-single digit to low double-digit percentage passings) from fiber overbuilders in the next decade in idiosyncratic situations where the economics make sense. We think FW will have a similar modest impact, building from zero share today to perhaps mid-single digit share in the long term. However, Shentel claims just 52% household penetration with its cable broadband product, leaving about 30% of internet market still in the hands of legacy, slow speed DSL. Over time DSL’s share should decline significantly, leaving room for Shentel to continue to grow cable broadband subscriber count despite the arrival of some fiber and FW.
Contrast this profile with the big cable companies:
We view Shentel’s cable business as a well-protected cash cow that should grow revenue organically in the low- to mid-single digits with gradual margin expansion, while providing cash flow and the backbone to propel Shentel’s emerging fiber business to success. In fact, in a few short years we expect the value of the company’s emergent fiber business to eclipse its cable operations.
Fiber Network
Shentel has a long history of intelligent network expansion. With its established cable footprint and deep local relationships, Shentel is well positioned to execute on its own fiber overbuilding plan in adjacent markets.
Shentel is targeting new fiber builds in nearby Tier 3 and Tier 4 cities that have adequate density to allow for a $1,200, or less, cost to pass. These markets are served today by only one broadband provider, the legacy cable network (typically Comcast) that enjoys a monopoly position, high prices, and high market share (75-85%).
When Shentel arrives with fiber they can offer faster speeds, higher reliability, and a lower price point (10-20% cheaper). Combined with local customer service (call centers based in western Virginia), Shentel provides an attractive customer value proposition.
Speed to market is essential since these markets can only economically support two high speed data providers. Shentel’s long-standing relationships with regulators and electric companies enable accelerated access to construction rights of way, and it can move efficiently by building off of its existing operations and contractor relationships.
Since 2019, Shentel has built 93K fiber passings, and has plans to achieve 450K passings by the end of 2026. We believe there is potential for expansion beyond this, but the roadmap is not yet clear enough to include that in the investment case.
We believe the economics of Shentel’s new builds should be very attractive. Modeling 38% year-five, and 40% year-seven market share in fiber markets, we believe Shentel could potentially achieve returns on capital in the mid-teens and returns on equity in the mid-20s. We have spoken with industry experts, evaluated case studies of other fiber buildouts, and studied Shentel’s to-date fiber cohort analysis to build confidence in our key assumptions.
From here, we view Shentel as largely an execution story on the fiber rollout. So, like always, management is critically important in our assessment. CEO, Chris French, has been at the company for the last thirty years. He has a long record of creating shareholder value and today owns 4% of the shares outstanding. The company has a history of making opportunistic acquisitions in both its cable and wireless businesses, and management believes they may have future opportunities when other fiber overbuilders, with less experience and more leverage, run into distress. We have confidence Chris and the rest of the management team are very focused on executing sharply on the fiber rollout and putting capital behind their highest return opportunities.
At current prices, we believe the market is assigning very little value to Shentel’s fiber build strategy. If we assign a market multiple to their cell tower business and value Shentel’s fiber build to date at cost, we believe the market is valuing Shentel’s cable business at ~9x EBITDA, which is a two-turn discount to its closest peer, CableOne. We are not the only ones who see value in the shares today; there has been sizeable insider buying from multiple company executives over the last few months.
Looking out five years, we think the combined value of the cell towers, cable network, and fiber business will be worth >$40/share, providing us a 15% base case 5-year IRR. During this period, we expect Shentel to compound consolidated EBITDA at ~17-18% per annum driven by a successful fiber rollout. This is with a net cash balance sheet today, and a fairly conservative net leverage of just below 3x EBITDA during the peak of the fiber buildout.
Click here for a full listing of Holdings.
Click here for full, standardized Fund performance.
- In this article:
- Domestic Equity
- Focus Fund
You might also like
-
 Portfolio Perspective
Focus FundSeeking Companies with Strong Growth at Attractive Valuations
David Rainey, CFACo-Portfolio Manager
Ira Rothberg, CFACo-Portfolio Manager
Brian Macauley, CFACo-Portfolio ManagerRead the CommentaryThe Portfolio Managers rely on their strategy of owning durable, well-run businesses capable of turning adversity into opportunity and adapting to macroeconomic surprises. The following Hennessy Focus Fund Commentary recaps the 2025 market and highlights areas of opportunity ahead.
-
 Portfolio Perspective
Focus FundFrom Rate Cuts to AI: Positioning the Portfolio for Potential Opportunity
David Rainey, CFACo-Portfolio Manager
Ira Rothberg, CFACo-Portfolio Manager
Brian Macauley, CFACo-Portfolio ManagerRead the CommentaryThe Portfolio Managers discuss holdings that could potentially benefit from lower rates, tariffs, and artificial intelligence (AI). The team also provides an update on AST SpaceMobile and discusses potential opportunities in select Technology and Health Care companies.
-
 Company Spotlight
Focus FundO’Reilly Automotive—Revved for Growth
David Rainey, CFACo-Portfolio Manager
Ira Rothberg, CFACo-Portfolio Manager
Brian Macauley, CFACo-Portfolio ManagerRead the SpotlightO’Reilly Automotive is a leader in the automotive aftermarket parts industry in the U.S. The company’s scale, unique distribution infrastructure, and customer service-oriented culture should allow it to take market share in a fragmented U.S. market for years to come.