Portfolio Update: Fund Trading at the Lowest Multiple Since 2011
In this letter we discuss the macro environment and provide an update of CarMax, one of the hardest hit cyclical growth stocks in the portfolio.
-
 David Rainey, CFACo-Portfolio Manager
 -
 Brian Macauley, CFACo-Portfolio Manager
 -
 Ira Rothberg, CFACo-Portfolio Manager
Commentary
The macroeconomic environment continues to be challenging. Persistent high inflation, rising interest rates, hawkish comments from the Federal Reserve, a rapidly strengthening dollar, and growing signs of economic slowdown contributed to another quarter of negative market performance.
Earnings growth for the Russell 3000® Index is still forecast to be a positive mid-single digit rate over 2022 and 2023, but this is down from a high single digit rate forecast at the beginning of this year.
In our portfolio, we forecast a low-single digit annualized earnings growth rate over 2022 and 2023, but this is down from our original expectation of a low double digit growth rate. Against this backdrop we have seen a significant (30%) decline in portfolio price year-to-date. Our portfolio now trades at 12.7x our 2023 earnings estimates (versus 15.0x for the Russell 3000 Index), the lowest multiple since 2011.
Looking below the portfolio’s surface, most businesses we own continue to experience good business trends with growing revenue and profits. It is the businesses we own with more cyclical exposure (most notably, about 17% of assets are in housing and big-ticket consumer discretionary markets) that have had their stocks hit the hardest. Many of these businesses are now down 40-50%-plus, and are trading at high single digit and low double-digit multiples of our earnings estimates compared to more normal high teens multiples. At these prices we think the market has already discounted a recession—and corresponding negative earnings revisions—into these stocks.
Recession or not, we do not think it will matter much to our portfolio in the fullness of time. Near-term earnings results are but a small part of the long-term stream of future cash flows that dictate what a company should be worth. And, as we have seen in past recessions, the types of companies that we typically own—industry leaders with strong balance sheets and excellent management teams—can sometimes use a recession to create a step function increase in long term value by taking advantage of consolidation and expansion opportunities that would not otherwise exist.
The economy and spending patterns have been highly unusual since the emergence of COVID-19 with demand fluctuating wildly across time and industry. This begs the question, how reliable are current earnings as an indicator of value? Are recent earnings reflective of enduring earnings power, or are our companies over-earning?
Overall, we do not think our businesses are overearning. We own long-established companies with observable revenue and profit patterns often across a decade or more. We can rewind the clock to before the pandemic to get an understanding
of baseline earnings, and extrapolate from there to estimate what profitability might have been today if the pandemic had not occurred. Current estimates do not depart significantly from our “COVID normalized” analysis, giving us confidence in the underlying earnings power of these businesses and their eventual stock price recovery.
We contrast this profile with those of the many speculative high growth technology and “story” stocks that are valued based upon projections of huge margin expansion and revenue growth far in the future. While some of these businesses will achieve their promise, we suspect that most will not, and equity holders will suffer a permanent impairment of capital.
To illustrate the point about our holdings, let’s review CarMax, one of the hardest hit cyclical growth stocks in our portfolio, down about 50% year-to-date, and down about 60% from a year ago.
In the fiscal year ended February 2020 (just before the impact of the pandemic), CarMax earned $5.33 in GAAP EPS, which climbed nicely over the preceding five years at a 15% CAGR.
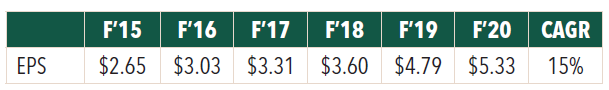
Key drivers to this EPS growth were new stores, market share gains at existing stores (comparable store sales), and repurchasing stock to reduce shares outstanding (plus a modest boost from the 2018 reduction in corporate tax rates).
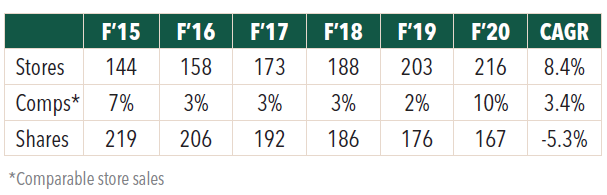
Importantly, during this period CarMax’s growth in EPS was not driven by a rapidly growing end market nor sharp improvement in profitability. Used car industry turnover approximated 40 million units, as it does almost every year, and CarMax’s profit margins were in a range of 6.1% to 6.8%, where they had held steady for a decade prior to the pandemic.
If we fast forward to today, we see that two of CarMax’s key value drivers—store count, and share count—are still marching forward (comparable store sales have been highly volatile due to the pandemic). The company has grown store count by more than 8% since February 2020, and reduced its share count by more than 4%.
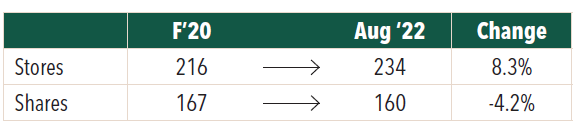
If we isolate these two value drivers it translates into about a 13% increase (8% more stores over 96% as many shares) in EPS from the $5.33 in Fiscal 2020, to $6.00 of earnings power today. This compares to recently reduced consensus EPS estimates for calendar 2023 of about $4.50 per share (down from actual results of $6.97 reported in calendar 2021). CarMax, at $61, is trading 13.5x this consensus $4.50 estimate, or just 10x our normalized earnings power estimate. Applying CarMax’s 10-year average 17x multiple to $6.00 in earning power implies a fair value of $102 per share, about 65% above the current price.
Of course, reality is more complicated than the simple $6.00 key value driver analysis we present above, but we believe this analysis is roughly correct and illustrates our broader point about observable earnings power providing a reliable underpinning for our intrinsic value estimates. One such complication: SG&A expenses at CarMax are elevated (as a % of gross profit) relative to history due to significant investment in digital initiatives, wage inflation, and the recent decline in unit sales (-8% retail unit comps in the just reported quarter). We believe that the step-up in digital spending over the last several years has plateaued and there will be significant expense leverage from here as volume grows on this relatively fixed cost base.
CarMax is now trading at a similar stock price to March 2020 when nearly all stores were closed and corporate survival was in doubt. There is no such existential threat facing CarMax today. CarMax is the leader in used car retail and has an investment grade balance sheet. It has survived three recessions since its founding and has emerged stronger each time. While industry sales are down for macroeconomic reasons, CarMax continues to gain market share—as it has nearly every year since its founding. In fact, we would argue that CarMax is now in its best competitive position in a long time. It is making breakthrough progress on its unique omnichannel retailing capabilities at the same time that Carvana, its most formidable challenger, is facing capital constraints and the very real possibility of bankruptcy (the business is encumbered with massive debt and negative free cash flow; the stock is down 95% from a year ago).
We believe that CarMax offers a compelling value for the long-term investor; the best risk-adjusted return profile we have seen in the stock since the depths of the Global Financial Crisis.
During turbulent times we gain confidence from owning a portfolio of high quality, well run, cash generative businesses—such as CarMax—at reasonable valuations that we believe are going to grow their earnings significantly over the next five and ten years. At the beginning of 2022, you had to pay roughly 18x earnings for our portfolio of businesses, now you pay roughly 13x. While our expectations for near term earnings growth have diminished, our long-term outlook is largely unchanged. We view this as a very attractive investment setup.
Click here for a full listing of Holdings.
Click here for full, standardized Fund performance.
- In this article:
- Domestic Equity
- Focus Fund
You might also like
-
 Portfolio Perspective
Focus FundSeeking Companies with Strong Growth at Attractive Valuations
David Rainey, CFACo-Portfolio Manager
Ira Rothberg, CFACo-Portfolio Manager
Brian Macauley, CFACo-Portfolio ManagerRead the CommentaryThe Portfolio Managers rely on their strategy of owning durable, well-run businesses capable of turning adversity into opportunity and adapting to macroeconomic surprises. The following Hennessy Focus Fund Commentary recaps the 2025 market and highlights areas of opportunity ahead.
-
 Portfolio Perspective
Focus FundFrom Rate Cuts to AI: Positioning the Portfolio for Potential Opportunity
David Rainey, CFACo-Portfolio Manager
Ira Rothberg, CFACo-Portfolio Manager
Brian Macauley, CFACo-Portfolio ManagerRead the CommentaryThe Portfolio Managers discuss holdings that could potentially benefit from lower rates, tariffs, and artificial intelligence (AI). The team also provides an update on AST SpaceMobile and discusses potential opportunities in select Technology and Health Care companies.
-
 Company Spotlight
Focus FundO’Reilly Automotive—Revved for Growth
David Rainey, CFACo-Portfolio Manager
Ira Rothberg, CFACo-Portfolio Manager
Brian Macauley, CFACo-Portfolio ManagerRead the SpotlightO’Reilly Automotive is a leader in the automotive aftermarket parts industry in the U.S. The company’s scale, unique distribution infrastructure, and customer service-oriented culture should allow it to take market share in a fragmented U.S. market for years to come.