
A Fund Focused on Valuation, Growth and Momentum
In the following commentary, the Portfolio Managers of the Hennessy Cornerstone Growth Fund discuss the Fund’s formula-based investment strategy and how it drives the Fund’s sector and industry positioning.
-
 Ryan C. Kelley, CFAChief Investment Officer and Portfolio Manager
 -
 L. Joshua Wein, CAIAPortfolio Manager
What is the Hennessy Cornerstone Growth Fund’s investment strategy?
The Fund utilizes a formula-based approach in building a portfolio of attractively valued stocks whose stock prices are exhibiting strong relative strength. The strategy seeks to combine elements of both value and momentum investing. From the universe of stocks in the S&P Capital IQ Database, the Fund selects the 50 stocks with the highest one-year price appreciation that also meet the following criteria:
» Market capitalization exceeding $175 million
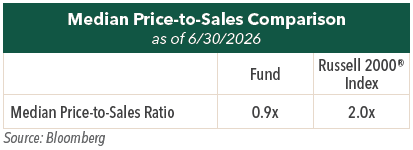
» Price-to-sales ratio below 1.5
» Annual earnings higher than the previous year
» Positive stock price appreciation over the past three- and six-month periods
Why does the Fund use these screening criteria?
The Fund uses a sales-based valuation metric because sales are more difficult to manipulate than earnings. The price-to-sales ratio works well under many conditions, including when a company’s profitability may be temporarily depressed or when earnings may be artificially inflated.
Higher year-over-year earnings help identify attractive companies, including those that are operating successfully in growth markets, gaining market share, or increasing profitability.
Positive price appreciation over three- and six-month periods generally reflects market recognition of improving underlying fundamentals in the near term.
Why does the formula select stocks with the highest one-year price appreciation?
From among the companies that meet the screening criteria, the Fund selects the 50 with the highest one-year price appreciation. We believe this ranking by relative share price strength can be a good predictor of future price appreciation, or outperformance.
How does the Fund seek to provide a return to investors?
We believe the Fund’s investments present the potential for capital appreciation as a result of earnings growth and potentially increasing valuations.
What is the Fund’s current market cap?
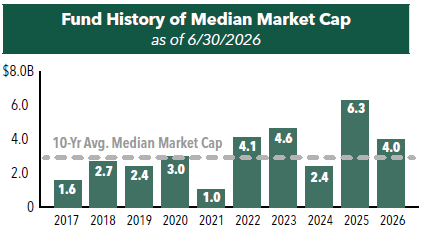
As of June 30, 2026, the Fund has a median market cap of approximately $4.0 billion, above its long-term average of $2.9 billion.
How often does the Fund rebalance its portfolio?
The universe of stocks is re-screened and the portfolio is rebalanced annually, generally in the winter. Holdings are weighted equally by dollar amount with 2% of the Fund’s assets invested in each.
How does the Fund’s portfolio differ from its benchmark?
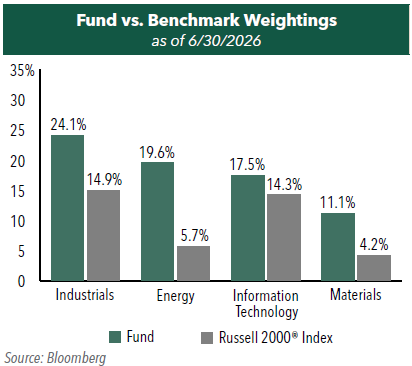
Compared to its benchmark, the Russell 2000® Index, the Fund is significantly overweight Industrials, Energy, Information Technology, and Materials. This is a significant change from last year’s holdings as much of the momentum in the stock market has changed dramatically from last year’s rebalance period. We note that the Fund has holdings in all sectors except Utilities. The Fund’s largest sector weight is Industrials (24%), which may be driven in 2026 by robust capital spending on A.I. infrastructure, grid electrification, reshoring of manufacturing facilities, and elevated defense budgets. The second largest sector, Energy (20%), could continue its momentum in the latter half of 2026 due to surging electricity demand from AI data centers and reshoring of manufacturing, combined with geopolitical issues. Technology (18%) will be driven by A.I. and the general demand in companies’ and consumers’ replacement cycles. Finally, Materials (11%) are becoming more and more important in manufacturing, while scarcity value and demand continue to increase globally for some metals and strategic chemicals. We believe the Fund’s sector allocations offer a diverse array of opportunities across many small cap companies.
- In this article:
- Domestic Equity
- Cornerstone Growth Fund
You might also like
-
 Investment Idea
The Big Potential of Smaller Companies
 Neil J. HennessyChief Market Strategist and Portfolio Manager
Ryan C. Kelley, CFAChief Investment Officer and Portfolio Manager
L. Joshua Wein, CAIAPortfolio ManagerRead the Investment Idea
Neil J. HennessyChief Market Strategist and Portfolio Manager
Ryan C. Kelley, CFAChief Investment Officer and Portfolio Manager
L. Joshua Wein, CAIAPortfolio ManagerRead the Investment IdeaFor much of the past decade, large-cap stocks have dominated market returns and investor attention. As a result, we believe many equity portfolios may now be heavily dependent on the continued performance of the market’s largest companies, potentially overlooking attractive opportunities elsewhere in the market.
-
 Fund Commentary
Focus FundHigh Conviction on Companies’ Long-term Future Earnings Power
 David Rainey, CFACo-Portfolio Manager
 Ira Rothberg, CFACo-Portfolio Manager
 Brian Macauley, CFACo-Portfolio ManagerRead the Commentary
The Portfolio Managers review the second quarter market and the influence of elevated inflation, rate hikes, the development of AI, and what gives them confidence in the portfolio’s ability to continue compounding earnings.
-
 Company Spotlight
Focus FundAST SpaceMobile: Transforming How the World Connects
David Rainey, CFACo-Portfolio Manager
Brian Macauley, CFACo-Portfolio Manager
Ira Rothberg, CFACo-Portfolio ManagerRead the SpotlightAST is building the first and only space-based cellular broadband network accessible directly by everyday smartphones with both commercial and government applications. With strategic investments from leading technology players such as AT&T, Verizon, Vodafone and Google, AST has the bold goal to provide uninterrupted broadband connectivity, everywhere.
