Portfolio Drivers: Mid-Caps, Spending and Housing
Portfolio Managers Ryan Kelley and Josh Wein review the Fund’s investment strategy and discuss the Fund’s most recent rebalance and changes in the portfolio composition. They also highlight the fundamental drivers of select sectors within the portfolio.
-
 Ryan C. Kelley, CFAChief Investment Officer and Portfolio Manager
 -
 L. Joshua Wein, CAIAPortfolio Manager
What is the Fund’s investment strategy?
The Cornerstone Mid Cap 30 Fund utilizes a quantitative formula to select 30 domestic, mid-cap stocks that exhibit both value and momentum characteristics, choosing stocks with higher year-over-year earnings, positive stock price appreciation, and lower price-to-sales ratios. The universe of mid-cap stocks is screened using these criteria, and the portfolio is rebalanced annually, generally in the fall.
Would you please discuss sector weightings and the themes supporting those sectors?
Following the most recent annual rebalance, the Fund’s portfolio is diversified across seven of the 11 GICS sectors. Financials holdings increased the most of any sector versus the prior portfolio and comprise about 20% of the portfolio. We view this as a potential positive driver of performance as we believe that the U.S. financial system is fundamentally strong and an essential component of a solid economy and flexible capital markets.
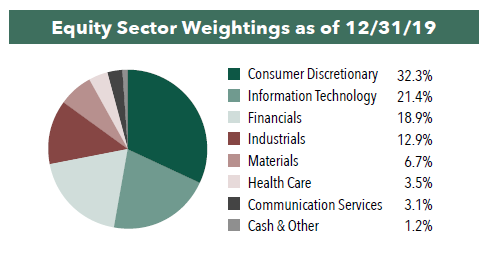
Compared to the Russell Midcap Index, the Fund continues to have a substantial overweight position in consumer stocks, with one third of the Fund invested in the Consumer Discretionary sector. Consumer spending continues to grow steadily this year, albeit at a more modest pace than in years past. Driven by increased job growth and higher wages, we believe this consumption should in turn drive higher growth in earnings and positive stock price performance for many retail and consumer stocks.
Is there a common investment theme in the current portfolio?
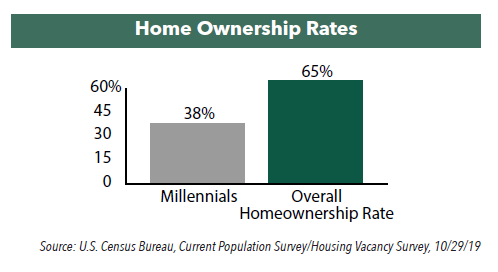
A common investment theme vital to many different holdings of the Fund, regardless of sector, is the strength of housing and housing-related stocks. Many of our portfolio companies benefit from a heathy real estate market, low interest rates, and spending on household goods. Specifically, four out of the 30 holdings are homebuilders, three are related to home furnishings and home appliances, and two of the insurance companies focus on title insurance and mortgage guaranty. While wage growth and low unemployment could lead to increased spending on household goods, homebuilding growth continues its prolonged expansion, with homebuilder confidence at multi-year highs, supply constraints driving increased need of new home starts, and low mortgage rates aiding affordability. Even millennials are purchasing homes, as homeownership rates within that demographic group have increased to 38%, higher than ever in the past, but still with plenty of room to grow compared to the overall homeownership rate of 65% for all age groups combined.
What is the median market capitalization of the Fund’s holdings following the most recent rebalance?
The Fund selects its holdings from a universe of midcap stocks with market capitalizations ranging from $1 billion to $10 billion. Following the rebalance, the Fund’s holdings had a median market cap of $5.6 billion at the end of December 2019. We believe mid-caps offer untapped potential and that investors may be surprised to learn that mid-cap stocks have outperformed both small- and large-cap stocks over the long term with less risk than small-cap stocks.
Would you please discuss the relative valuation of the Fund’s holdings compared with the benchmark?
Attractive valuation is an important factor in the Fund’s stock selection process. The Fund uses price-to-sales as its primary valuation metric because it is a simple metric, can be universally applied, and is difficult for companies to manipulate. The Fund selects stocks with a price-to-sales ratio below 1.5x, and the median price-to-sales ratio of the portfolio was just 0.8x at the time of rebalance compared to 1.6x for its benchmark index, the Russell Midcap Index.
The Fund’s holdings are also trading at a discount in terms of price-to-earnings. The Fund’s average price-to-earnings ratio was 17.6x at the end of December 2019 versus 23.8x for its benchmark index.
- In this article:
- Domestic Equity
- Cornerstone Mid Cap 30 Fund
You might also like
-
 Portfolio Perspective
Focus FundSeeking Companies with Strong Growth at Attractive Valuations
 David Rainey, CFACo-Portfolio Manager
 Ira Rothberg, CFACo-Portfolio Manager
 Brian Macauley, CFACo-Portfolio ManagerRead the Commentary
The Portfolio Managers rely on their strategy of owning durable, well-run businesses capable of turning adversity into opportunity and adapting to macroeconomic surprises. The following Hennessy Focus Fund Commentary recaps the 2025 market and highlights areas of opportunity ahead.
-
 Portfolio Perspective
Focus FundFrom Rate Cuts to AI: Positioning the Portfolio for Potential Opportunity
David Rainey, CFACo-Portfolio Manager
Ira Rothberg, CFACo-Portfolio Manager
Brian Macauley, CFACo-Portfolio ManagerRead the CommentaryThe Portfolio Managers discuss holdings that could potentially benefit from lower rates, tariffs, and artificial intelligence (AI). The team also provides an update on AST SpaceMobile and discusses potential opportunities in select Technology and Health Care companies.
-
 Company Spotlight
Focus FundO’Reilly Automotive—Revved for Growth
David Rainey, CFACo-Portfolio Manager
Ira Rothberg, CFACo-Portfolio Manager
Brian Macauley, CFACo-Portfolio ManagerRead the SpotlightO’Reilly Automotive is a leader in the automotive aftermarket parts industry in the U.S. The company’s scale, unique distribution infrastructure, and customer service-oriented culture should allow it to take market share in a fragmented U.S. market for years to come.