Portfolio Update: Results Recap and Investment Outlook
Portfolio Managers at Broad Run Investment Management, LLC, the Fund’s sub-advisor share their quarter-end results recap and 2021 investment outlook.
-
 David EllisonPortfolio Manager
 -
 Brian Macauley, CFACo-Portfolio Manager
 -
 Ira Rothberg, CFACo-Portfolio Manager
For the year, the Hennessy Focus Fund Institutional share class returned 5.88% net of fees compared to 20.89% for the Russell 3000 Index. We remind you that we manage the Fund for long-term results, so we encourage you to evaluate its performance over a multi-year time frame.
Wow, what a year! A global pandemic, lockdowns, riots, and political unrest. The economic shutdowns in March and April drove the worst quarterly decline in U.S. GDP and highest levels of unemployment since the Great Depression. Quick monetary policy response and government stimulus halted the downward economic spiral and catalyzed the beginning of a rebound. By summer, a better understanding of Covid-19 transmission enabled some improved mobility and exiting 2020 we had several highly effective vaccines allowing us to look to 2021 as a year of recovery.
With this backdrop, we have more than usual to discuss in our letter, so we divided it into five sections:
1. Fundamental Performance of our Businesses
2. Investment Performance
3. Investment Outlook
4. Portfolio Actions
5. Conclusion
Fundamental Performance of our Businesses
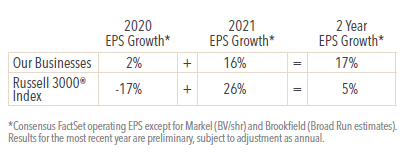
Considering the circumstances, we are pleased with the fundamental performance of our businesses through this tumult. The look-through earnings of the Fund held up much better than the broader market in 2020 with a 2% expected increase compared to a 17% expected decline for the Russell 3000® Index. Of course, we are only part way though the pandemic and related recession. Taking a two-year view that incorporates both the decline in 2020 and the expected rebound in 2021, our businesses still look quite good with 17% cumulative earnings growth versus 5% for the broader market.
Click here for Fund Performance.
To provide a more granular view, in the table below we present the 2020 and 2021 estimated earnings performance for each of the businesses we owned at the beginning of the pandemic. Please note that earnings growth is not representative of the Fund’s future performance.
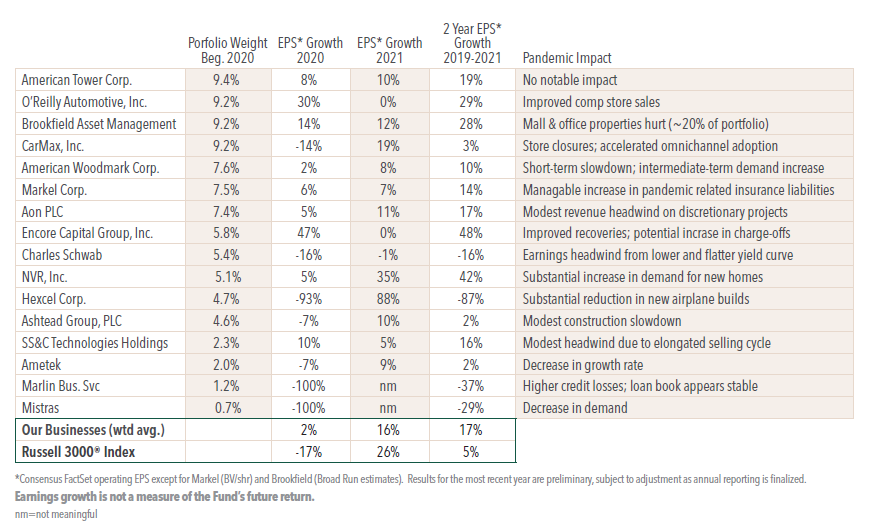
However, we think this earnings performance speaks to the quality and resiliency of the businesses we own. We always underwrite our investments with an expectation that a recession will happen during our holding period, so we did not need to undertake businesses in light of the new circumstances, adding four new positions and eliminating two (discussed later in this letter), but the core of the portfolio is largely unchanged.
Reflecting on the cadence of the year, at the beginning of the pandemic many of our businesses were significantly impacted by the lockdowns – particularly our retail, travel, and housing-related names such as CarMax, O’Reilly, Hexcel, American Woodmark, and NVR – but most staged strong recoveries in late spring as lockdowns were relaxed. Some even emerged as net beneficiaries (O’Reilly, NVR, RH) as new consumer spending patterns developed.
Around the middle of the year many of our businesses pivoted from defense to offense, taking advantage of the circumstances to improve their longer-term prospects. These are the types of businesses and management teams that we try to align ourselves with. We highlight CarMax (increased substantial repositioning when that eventuality occurred. We, of course, reassessed all our omnichannel investment), Brookfield (acquisition of mall and office property affiliate), RH (accelerated real estate procurement in an oversupplied market), and Allegiant Travel (launch of new routes and acquisition of airplanes in a distressed market) as the more notable examples of this. Experience has taught us that it tends to be those companies that are opportunistic in a downturn that fuel outsized value creation in subsequent years.
At present, we view Hexcel (4.0% of 12/31/20 assets), Marlin Business Services (1.1% of 12/31/20 assets), and Mistras Group (0.7% of 12/31/20 assets) as the only companies we currently own that will not make a full recovery from the pandemic in the next year or two. We continue to hold each of these businesses after re-underwriting them using new assumptions.
Investment Performance
The Hennessy Focus Fund Institutional share class returned 5.88% for the year, net of fees. For a recessionary year, this would normally be a happy outcome, if not for the Russell 3000® Index posting a 20.89% return. We typically avoid discussing short-term performance, but given the magnitude of this relative underperformance (and its negative impact on our longer-term relative results) we want to share our perspective.
We run a concentrated portfolio, built from the bottom up without regard for sector weightings. As a result, our portfolio looks very different from an index, and we are virtually guaranteed to underperform from time to time. We accept this as a price we must pay for the opportunity to achieve our objective of compounding capital at a superior rate, with prudence, over time.
Our underperformance in 2020 is in large part attributable to our limited exposure (2% at the beginning of 2020) to the Information Technology sector. For the year, Information Technology returned 44%, contributing 11 points to the Russell 3000 Index return. This caps a 3-year period when the Information Technology sector was up 122% (31% annualized) compared to 36% (11% annualized) for non-technology companies.
We are not averse to technology. We own positions in SS&C Technologies, a software company, and CDW, a technology distributor. We own American Tower, a real estate company providing critical infrastructure for mobile phones, drones, autonomous vehicles, and the Internet of Things. And we own companies such as Aon and CarMax, that are investing heavily in technology to put greater distance between themselves and their competition. Sometimes it is the application of technology to a business with an established moat that creates more value than investing directly in the technology provider itself.
The world is digitizing, and there are some wonderful technology businesses creating a lot of value enabling this trend. We have many of them on our Watch List. Our low exposure is simply a result of being unable to find quality technology companies trading with an adequate “margin of safety”; to justify today’s prices, most require aggressive revenue growth and margin assumptions far into the future.
Lofty expectations are not limited to technology companies; we see frothiness in many high growth and concept companies across sectors. Consider that U.S. companies that lose money currently have a $6 trillion market value, 3x more than at the peak of the Internet Bubble. These companies have market values dependent on far off terminal year projections which are subject to wild overestimation in periods of market ebullience. Some of the most outlandish assumptions are reserved for early-stage companies claiming to be “disrupting” a large existing industry. Many electric vehicle companies fall in this category, and there are scores of others addressing insurance, auto retail, media, banking, transportation, energy, and other industries. The flood of Special Purpose Acquisition Companies (SPACs) has further enabled this frenzy, acquiring moon-shot companies and forecasting 10x and 15x revenue growth over a five-year period to help justify their prices. When valuations look stretched on an EV/sales basis, SPAC sponsors have begun to use EV/total addressable market multiples, a valuation metric so dubious it is comical.
We are twelve years into a bull market and the risk pendulum has swung full range from fear to greed. There were ample signs of excessive risk taking in 2018 and 2019, but 2020 has been fuel on the fire. A zero interest rate policy, massive fiscal stimulus, and increased retail participation have all arrived on the scene. Stimulus checks and reduced spending on leisure activities boosted personal savings by a remarkable $1.4 trillion in 2020. Many people who are now working from home have found themselves flush with cash, flush with time, and dreaming of day trading their way to that new Tesla or beach home.
Successful long-term investing is often as much about what one chooses to avoid, as what one chooses to own. In our nearly 25 years as professional investors, we have only seen today’s level of stock speculation once before: in late 1999 through early 2000. Clearly areas of obvious speculation should be avoided by a prudent investor, but this is also a cautionary sign about the risk environment we are in. It heightens our skepticism about many companies in Information Technology and other pockets of the market that have been “hot” and where valuations rely upon very rosy forecasts. Fortunately, we do not need to bet on the disrupters, or against them, or own even a single technology company to be able to populate our portfolio and achieve our investment objectives. In today’s market there remain plenty of businesses available – mostly in the “not hot” sectors – that can deliver attractive long-term growth at reasonable valuations.
Investment Outlook
We underwrite our investments to target a mid-teens rate of return. We seek this return via the compounding of earnings per share over time rather than a change in valuation or clever trading in or out of a stock. As a result, our portfolio performance is primarily driven by the earnings per share growth of the underlying businesses that we own.1 Quite simply, our investment returns are going to be driven by the amount by which our businesses are able to grow their earnings over the next five years, not whether or not we own a particular hot market sector.
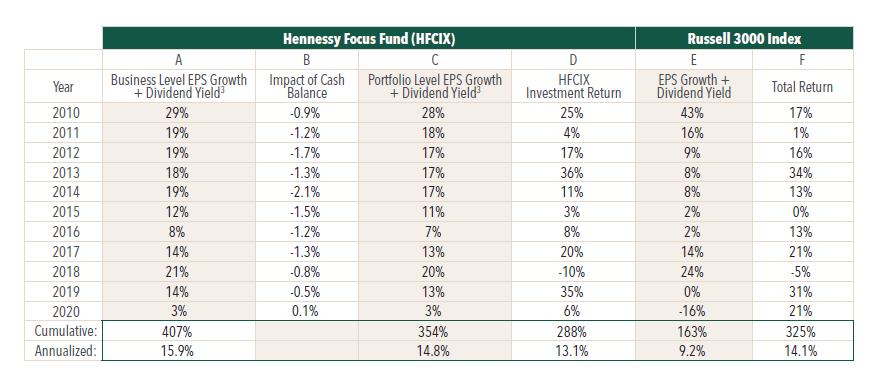
You can see this relationship in the table below. Over the last eleven years our portfolio level earnings per share compound annual growth rate (CAGR) is 14.8%, inclusive of dividends [column C] compared to an investment return of 13.1% [column D]. In any one year this is a loose relationship, but it strengthens considerably as time extends.
Today, we are pleased with the portfolio of businesses we own. We believe them to be high quality, well run, and likely to grow earnings per share at a mid-teens rate over the next five-plus years. We will not be right about every business we own. There will be individual disappointments in the future as there have been in the past, but historically the portfolio has been able to absorb these and deliver on our overall earnings growth objective.
Portfolio valuation today, at 16.6x 2021 earnings estimates, is roughly in line with the long-term valuation for the portfolio. We expect portfolio returns will closely track the earnings growth of our portfolio over the next five years, with the obvious caveat that steadily rising rates would present a headwind that could clip a few points per annum off of returns over the period.
It is interesting to note that the market at 23.4x 2021 earnings estimates, is trading 40% above our portfolio at 16.6x, versus a history of near parity. We think this helps explain some of our recent relative underperformance and supports our view that better relative results may lie ahead.
As Mark Twain once said, “History doesn’t repeat itself, but it does rhyme.” When the Internet Bubble burst in March of 2000, formerly unloved and inexpensive stocks performed well even as the NASDAQ declined by 78%. Stocks that were reasonably valued on earnings marched forward while many that were valued on eyeballs or clicks plummeted. This time around we are again seeing nonsensical valuation metrics employed in the more speculative corners of the market. While we do not know the timing or the trigger, we suspect that the excesses will be wrung out and stocks of healthy businesses that are reasonably valued on earnings will outperform in the fullness of time.
Portfolio Actions
As mentioned earlier, we added four new positions this year: Fastenal, RH, Allegiant Travel, and CDW. We discussed the first three of these purchases in earlier quarterly letters and discuss CDW below. We also added to our existing SS&C position, approximately doubling it from 2% of assets to 4% during the first quarter, and we added to our Allegiant Travel position in the fourth quarter bringing it to about 2% of assets.
Our general approach during the year was to look for extraordinary businesses suffering short-term setbacks (and corresponding depressed stock prices), but with their long-term prospects undiminished or even enhanced because of the pandemic. We sourced capital for purchases by selling two positions in which we had diminished conviction (Charles Schwab and Ametek), and by trimming two other positions whose businesses and stock prices had held up relatively well (O’Reilly Automotive and American Tower). In total these new positions comprise about 9% of assets at year end, and about 14% inclusive of SS&C.
CDW Corporation (CDW) - During the fourth quarter we established a 1% position in CDW Corporation. CDW is a value-added reseller (VAR) of information technology hardware, software, and services. Its products cover the gamut from desktop computers and networking equipment to peripherals and cloud-based software.
CDW is more than twice as large as its nearest competitor in an industry where scale matters. This affords CDW larger volume discounts and increased vendor support, as well as better product breadth, availability, and delivery speeds for customers. In addition to scale advantages, CDW also enjoys consultative relationships with its 250,000 customers. These customers, which are typically generalist IT professionals within an organization, look to CDW for trusted advice to select the best IT products and system configurations. As a result, CDW fosters strong customer relationships, and it typically wins business with service, rather than price, enabling industry leading margins.
Central to CDW’s success is its sales culture that it purposefully manages though hiring, training, and commission-based compensation programs. This combination of scale and a great sales culture has enabled CDW to grow revenue organically at about a 9% rate over the last decade, outpacing the IT market by about 450 basis points per annum. Today CDW has just 5% share of its addressable market leaving a very long runway for continued growth.
One mega-trend impacting nearly the entire technology space is the transition from on-premises software and servers, to off-premises cloud delivered software and infrastructure-as-a-service (AWS, Microsoft Azure, Google Cloud, etc.). Our conversations with technology professionals and former CDW employees lead us to believe that this transition will be a meaningful net positive development for CDW. While revenue from some hardware categories will face headwinds, those are more than offset by the company’s increased opportunity in cloud solutions. For a VAR, hardware is a one-time sale, and typically low gross margin, while cloud solutions are typically recurring revenue with very gross high margins (100% in some cases). While this mix shift could present an optical headwind to reported revenue dollar growth, it should provide a nice tailwind to reported gross profit dollar growth. As CDW gradually transitions to higher margins and more recurring revenue we believe it becomes a better business than it already is, with the corresponding potential for a valuation rerating by the market.
With a growing IT market, scale advantages, and a great sales culture we believe that CDW can grow its gross profit dollars at a high single digit rate and grow earnings per share at a mid-teens rate or higher for at least the next five years. Today the stock trades at about 20x forward earnings, a discount to the market. Given its better-than-market growth and below-market valuation, we believe CDW can be a long-term compounder for us.
Click here for the Focus Fund portfolio holdings.
Conclusion
We thank you for entrusting your capital to us. We will continue to do our best to protect and grow your investment over time.
Sincerely,
Broad Run Investment Management, LLC
- In this article:
- Domestic Equity
- Focus Fund
1 This is axiomatic, if there is no change in valuation and no dividends, stock performance will match the change in earnings per share. While earnings per share growth is not particularly useful to measuring progress at many types of investment strategies - for example, a high valuation-high growth strategy, a slow/no growth-deep value strategy, or a high turnover strategy - it is highly instructive for our type of strategy.
You might also like
-
 Portfolio Perspective
Focus FundSeeking Companies with Strong Growth at Attractive Valuations
 David Rainey, CFACo-Portfolio Manager
Ira Rothberg, CFACo-Portfolio Manager
Brian Macauley, CFACo-Portfolio ManagerRead the Commentary
David Rainey, CFACo-Portfolio Manager
Ira Rothberg, CFACo-Portfolio Manager
Brian Macauley, CFACo-Portfolio ManagerRead the CommentaryThe Portfolio Managers rely on their strategy of owning durable, well-run businesses capable of turning adversity into opportunity and adapting to macroeconomic surprises. The following Hennessy Focus Fund Commentary recaps the 2025 market and highlights areas of opportunity ahead.
-
 Portfolio Perspective
Focus FundFrom Rate Cuts to AI: Positioning the Portfolio for Potential Opportunity
David Rainey, CFACo-Portfolio Manager
Ira Rothberg, CFACo-Portfolio Manager
Brian Macauley, CFACo-Portfolio ManagerRead the CommentaryThe Portfolio Managers discuss holdings that could potentially benefit from lower rates, tariffs, and artificial intelligence (AI). The team also provides an update on AST SpaceMobile and discusses potential opportunities in select Technology and Health Care companies.
-
 Company Spotlight
Focus FundO’Reilly Automotive—Revved for Growth
David Rainey, CFACo-Portfolio Manager
Ira Rothberg, CFACo-Portfolio Manager
Brian Macauley, CFACo-Portfolio ManagerRead the SpotlightO’Reilly Automotive is a leader in the automotive aftermarket parts industry in the U.S. The company’s scale, unique distribution infrastructure, and customer service-oriented culture should allow it to take market share in a fragmented U.S. market for years to come.