Natural Gas Utilities as a Potential Growth Story
With AI-driven power demand, rising capital investments, LNG growth, and pipeline infrastructure expansion, natural gas utilities are being repositioned as potential growth stories with attractive valuations and dividends.
-
 Ryan C. Kelley, CFAChief Investment Officer and Portfolio Manager
 -
 L. Joshua Wein, CAIAPortfolio Manager
Key Takeaways
» Tailwinds for utilities include rising power demand, expanding spending, and investors viewing utilities as growth stories.
» Major geographies, including the EU and Canada, have policies in place that could influence demand over the next few years.
» The surge in U.S. LNG exports has been supported by new and expanded export facilities coming online.
» Due to AI and data center growth, there is an urgent need for flexible power capacity. Natural gas remains the dominant cost-effective provider of ready power and reliability.
Please summarize the factors driving Utilities’ performance in 2025.
Utilities’ returns in 2025 has been driven by several structural tailwinds, including the following:
• Rising power demand beyond the traditional residential and industrial base due to the surge in demand from artificial intelligence (AI) and data centers.
• Expanding investments. Capital expenditures (capex) expanded meaningfully in the year with major grid and generation upgrades planned for the foreseeable future. Spending continues for renewables, storage technologies, and pipe replacement, driving higher capex which boosts growth and earnings as utilities are able to earn a return on their capex spending.
• Utilities stocks as potential growth stories. Traditionally, utilities are seen as a defensive, income-oriented investment. Due to the relative surge in demand, they are now being repositioned in investors’ minds as potential growth stories as well.
Would you please discuss the drivers of pipeline expansion projects?
Rising electricity demand, driven in part by data centers and related uses, is increasing the need for both additional generation capacity and expanded pipeline infrastructure. Pipeline projects are being considered because existing infrastructure is constrained and may be insufficient to meet anticipated load growth.
On the generation side, natural gas–fired plants are often preferred because they can be brought online relatively quickly and complement intermittent renewable sources such as wind and solar. While nuclear power is viewed as an efficient long-term solution, its development timelines remain uncertain.
What recent policy or regulatory developments are most likely to influence natural gas demand over the next few years?
Major geographies have each put forth regulatory policies that could influence demand over the next several years. Some of these include the following initiatives:
• The European Union (EU) is advancing post 2030 climate and energy policies including gas demand reduction measures under REPowerEU (energy savings, efficiency targets, and diversification away from pipeline gas) that would lower gas consumption and influence long-term demand.
• Canada recently announced methane emissions regulations for the oil and gas sector, placing stricter limits on methane leaks that influence the cost of gas productions and transmission.
• In the U.S., permitting and regulatory support for liquefied natural gas (LNG) export terminals continues to be favorable. On the other hand, debates are ongoing over potential rollbacks or revisions to Environmental Protection Agency authority and guidelines that could positively affect gas fired electricity generation.
U.S. exported record levels of LNG in September 2025. What drove the record levels and what is the Fund’s exposure to LNG?
The surge in U.S. LNG exports has been supported by new and expanded export facilities coming online in 2025, including Venture Global’s Plaquemines LNG and Cheniere’s Corpus Christi Stage 3 project. Additional plant expansions and new liquefaction trains enabled the U.S. to export more than 10 million metric tons in a single month. More liquefaction capacity directly increases how much LNG can be produced and shipped. In addition, strong demand from Europe and parts of Asia, driven by energy security concerns tied to the ongoing Russian-Ukraine conflict and colder European weather, also contributed.
While several Fund holdings have indirect LNG exposure, Cheniere Energy remains the only pure-play LNG exporter.
How should investors think about the impact of AI/data centers on overall energy demand and what does that imply for the role of natural gas?
AI and data center growth is materially increasing electricity demand as data centers are already about 4% of U.S. power use and forecasts call for a meaningful increase by 2030. As a result, there is an urgent need for flexible, firm capacity. Natural gas remains the dominant cost-effective provider of ready power and reliability. AI-driven power demand supports natural gas across generation, infrastructure, and reliability for the foreseeable future as it is both flexible and reliable.
How do Utilities’ valuations compare to the overall market currently and historically?
Despite utilities’ solid returns in 2025, valuations remain attractive versus overall market and historically. As of the end of 2025, utilities traded at 17.6x 2026 estimated earnings, about 79% of the S&P 500’s 22.2x. Historically, utilities have traded at a premium. In addition, utilities are trading at about 8% lower than their historical average as the average price-to-earnings (P/E) over the past 10 years for utilities has been 19.0x.
What is the Fund’s holdings’ earnings growth and the current level of dividends?
The earnings per share (EPS) growth for the Fund has been about 5% per year for the past 5 years. Yet, we are in a period of above long-term average projected EPS growth for utilities in general. In fact, earnings growth projections from many utilities, especially natural gas utilities, continue to be in the 5-8% range over the next 5 years.
As of December 31, 2025, 45 out of 46 holdings pay a dividend with an median yield of 3.4%.1 Approximately 95% of holdings have increased their dividends over the past year.
What is the current composition of the Fund?
As of December 31, 2025, multi-utilities and electric utilities comprised approximately 43% of the Fund’s assets, pipeline and LNG export companies made up 38%, and pure play natural gas utilities composed 13%. The remaining 6% of the Fund is made of Berkshire Hathaway and water utilities.

What’s the biggest 2026 tailwind for U.S. natural gas utilities in your view, and what’s the biggest risk that could derail it?
We believe the largest tailwind for natural gas utilities is the healthy and growing domestic demand for electricity production and global demand for LNG.
Conversely, risks include less competitive prices and lower demand due to slower-than-expected data center/AI growth and more moderate weather.
- In this article:
- Energy
- Gas Utility Fund
You might also like
-
 Fund Commentary
Gas Utility FundMeeting America’s Growing Energy Needs with Natural Gas
Ryan C. Kelley, CFAChief Investment Officer and Portfolio Manager
L. Joshua Wein, CAIAPortfolio ManagerRead the CommentaryThe Portfolio Managers discuss the drivers behind the Fund’s outperformance, the industry’s long-term growth outlook, and why utilities remain attractively valued.
-
 Sector Highlight
Strength of U.S. Natural Gas Reinforced by Global Energy Turmoil
Ryan C. Kelley, CFAChief Investment Officer and Portfolio Manager
L. Joshua Wein, CAIAPortfolio ManagerRead the Sector HighlightThe Hennessy Gas Utility Fund portfolio managers joined a record-setting crowd at this year’s AGA Financial Forum. With the heightened geopolitical uncertainty amplifying the strengths of the U.S. natural gas industry, the Forum provided an opportunity to better understand the evolving opportunities and challenges facing gas utility companies.
-
 Investment Idea
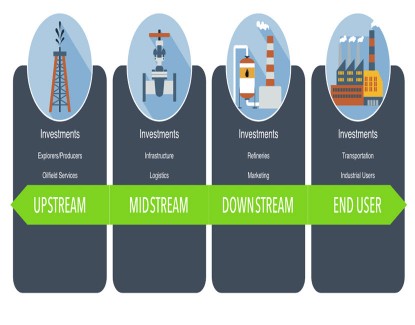
Defining the Energy "Value Chain"
 Ben Cook, CFAPortfolio ManagerRead the Investment Idea
Energy is a large and complex sector. The sector’s broad sub-industries can be divided into a “value chain,” each segment of which has different characteristics and offers different investment opportunities.